Banks’ overdraft/NSF fee revenue declines significantly compared to pre-pandemic levels
Third quarter of 2022 is down more than 40% compared to third quarter of 2019, suggesting $5B reduction in fees on annual basis.
Since late 2021, several banks have announced changes to their overdraft programs that have been expected to reduce overdraft/non-sufficient fund (NSF) fee revenue. Our most recent analysis finds that bank overdraft/NSF fee revenue:
- was 43% lower in the third quarter of 2022 than in the third quarter of 2019 before the COVID-19 pandemic onset – suggesting $5.1 billion less in fees on an annualized basis;
- was 33% lower over the first three quarters of 2022 compared to the same period in 2019; and
- has trended downward in each quarter since the fourth quarter of 2021.
At the same time, we have not observed correlating increases in other listed checking account fees, which suggests that banks are not replacing overdraft/NSF fee revenue with other fees on checking accounts.
This analysis of bank call report data follows our previous analyses of trends in checking account fee revenue published in December 2021 and July 2022.
Overdraft/NSF Fee Revenue
Bank overdraft/NSF fee revenue1 was lower in 2020 and early 2021 than before the pandemic, which was likely largely due to pandemic-related stimulus checks pushing up average checking account balances. In the second half of 2021, as the pandemic stimulus wound down, overdraft/NSF fee revenue rebounded somewhat but began decreasing again through the third quarter of 2022 – likely due to changes in bank policies.
Across the first three quarters of 2022, combined overdraft/NSF revenue was $5.8 billion, compared to $8.6 billion across the first three quarters of 2019—a decrease of 33%. For the third quarter of 2022 alone, reported overdraft/NSF revenue was $1.8 billion, compared to $3.1 billion in the same quarter in 2019—a decrease of 43%.
Overdraft/NSF revenue often varies based on seasonal patterns, but it trended downward throughout the first nine months of 2022, as banks reported $2.11 billion, $1.90 billion, and $1.75 billion during the first, second, and third quarters, respectively. This trend suggests that overdraft/NSF policy changes are starting to impact bank revenues.
Figure 1 shows the reported bank overdraft/NSF fee revenue by quarter, beginning in the first quarter of 2019.
Figure 1: Quarterly overdraft/NSF revenue Q1 2019 to Q3 2022
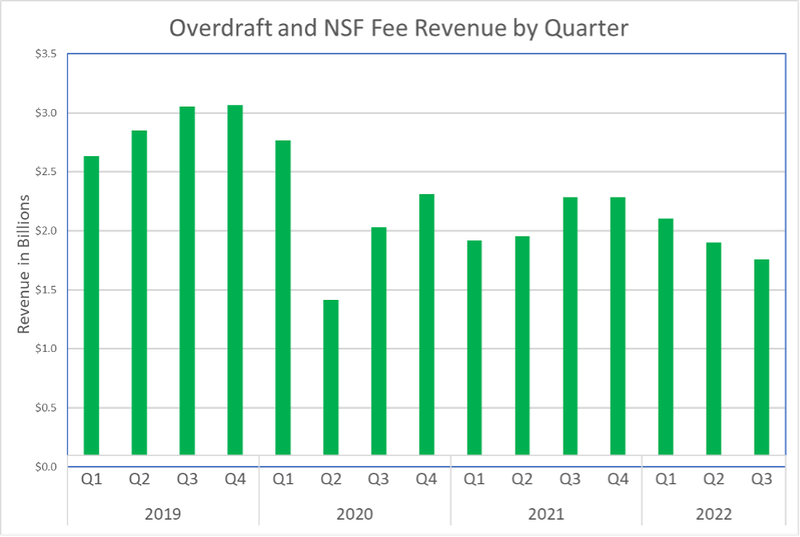
Table 1 shows overdraft/NSF revenue changes across specific banks and groups of banks. The individual banks listed were the largest generators of overdraft/NSF revenue in 2021, with each collecting more than $200 million in these fees.
Table 1 also shows trends among four groups of banks that generated $200M or less in OD/NSF fee revenue in 2021, consisting mainly of small and midsize banks (referred to as “small/midsize bank groups”).2
Despite the overall decrease in overdraft/NSF fee revenue, we continue to see significant differences across banks and groups of banks. While this evidence is indirect and does not control for changes in the number, composition, or behavior of accountholders, the variations likely reflect, at least in part, changes in overdraft/NSF programs.3
Table 1: Change in overdraft/NSF fee revenue through the third quarter of 2022 versus pre-pandemic 2019 baseline and 2021 for select individual banks and groups of banks
Overdraft/NSF Revenue
Select Individual Financial Institutions
| Institution | Number of Financial Institutions | Group Revenue ($M) through Q3 2022 | % Change vs. 2019 (Q1-Q3) | $ Change ($M) vs. 2019 (Q1-Q3) | % Change 2022 vs. 2021 (Q1-Q3) | $ Change ($M) 2022 vs. 2021 (Q1-Q3) |
|---|---|---|---|---|---|---|
Wells |
1 |
1032 |
-17.2% |
-214 |
2.9% |
29 |
JPMC |
1 |
945 |
-37.3% |
-562 |
2.3% |
21 |
BofA |
1 |
357 |
-69.3% |
-804 |
-56.6% |
-466 |
TD |
1 |
336 |
-19.4% |
-81 |
-3.2% |
-11 |
Truist |
1 |
274 |
-36.5% |
-157 |
-9.0% |
-27 |
Regions |
1 |
221 |
-19.6% |
-54 |
0.0% |
0 |
U.S. Bank |
1 |
206 |
-41.4% |
-146 |
-14.9% |
-36 |
PNC |
1 |
177 |
-55.0% |
-216 |
-15.8% |
-33 |
Financial Institutions grouped according to 2021 OD/NSF fee revenue
| Group by 2021 OD/NSF fee revenue | Number of Financial Institutions | Group Revenue ($M) through Q3 2022 | % Change vs. 2019 (Q1-Q3) | $ Change ($M) vs. 2019 (Q1-Q3) | % Change 2022 vs. 2021 (Q1-Q3) | $ Change ($M) 2022 vs. 2021 (Q1-Q3) |
|---|---|---|---|---|---|---|
50m to 200m |
10 |
824 |
-31.0% |
-370 |
-7.7% |
-69 |
10m to 50m |
47 |
775 |
-16.5% |
-154 |
12.2% |
85 |
2m to 10m |
123 |
466 |
-4.4% |
-22 |
24.5% |
92 |
Under 2m |
277 |
151 |
-10.9% |
-18 |
20.6% |
26 |
Individual Financial Institutions and Grouped Financial Institutions
| Institution | Number of Financial Institutions | Group Revenue ($M) through Q3 2022 | % Change vs. 2019 (Q1-Q3) | $ Change ($M) vs. 2019 (Q1-Q3) | % Change 2022 vs. 2021 (Q1-Q3) | $ Change ($M) 2022 vs. 2021 (Q1-Q3) |
|---|---|---|---|---|---|---|
Total |
465 |
5763 |
- |
-2797 |
- |
-390 |
The eight individual banks listed in Table 1 all report declines in their overdraft/NSF fee revenue across the first three quarters of 2022 relative to the same period in 2019. Specifically:
- Bank of America experienced the most significant decline (69.3%), which may reflect the reduction of its overdraft fee to $10 and the elimination of NSF fees, among other changes.
- PNC (55.0%) and U.S. Bank (41.4%) also experienced declines above 40% as compared to 2019. PNC has implemented a limit of one overdraft fee per day and eliminated NSF fees, among other changes. U.S. Bank has implemented a $50 negative balance cushion and a grace period until the end of the next day before an overdraft fee is charged, as well as eliminated NSF fees.
- JPMC and Truist experienced declines of 37.3% and 36.5%, respectively. JMPC has implemented a $50 cushion and grace period until the end of the next day. Both banks have eliminated NSF fees.
- Wells Fargo (17.2%), TD Bank (19.4%), and Regions Bank (19.6%) experienced relatively smaller declines.
All the small/midsize bank groups also report reduced overdraft/NSF revenues through the first three quarters of 2022 compared to those of 2019. Banks that reported between $50 and $200 million in overdraft/NSF fee revenue during 2021 reported the most significant decrease (31.0%). In contrast, those reporting between $2 million and $10 million reported the least significant decrease (4.4%).
One midsize bank within the $50 million to $200 million group, Capital One, experienced a drop in overdraft/NSF fee revenue of 98.1%, which is larger than any of the select individual banks, during the first three quarters of 2022 compared to the same period in 2019. Capital One eliminated all overdraft and NSF fees in early 2022.
Other Listed (Maintenance and ATM) Fee Revenue
Call reports require banks to list consumer deposit account revenue from three sources: 1) combined overdraft and NSF fees, 2) periodic maintenance fees, and 3) ATM fees. We refer to these three types of fees as “listed fees.” In Table 2 (structured similarly to Table 1), we report changes in listed fees other than overdraft/NSF fees, i.e., maintenance and ATM fees, to examine whether certain fees may have been increased to replace reduced overdraft/NSF fee revenue.
We did not identify a clear correlation between declines in overdraft/NSF fee revenue and increases in other fee revenue.
Table 2: Change in other listed (maintenance and ATM) fee revenue through the third quarter of 2022 versus pre-pandemic 2019 baseline and 2021 for select individual banks and groups of banks
Other Listed (Maintenance and ATM) Fee Revenue
Select Individual Financial Institutions
| Institution | Number of Financial Institutions | Group Revenue ($M) through Q3 2022 | % Change vs. 2019 (Q1-Q3) | $ Change ($M) vs. 2019 (Q1-Q3) | % Change 2022 vs. 2021 (Q1-Q3) | $ Change ($M) 2022 vs. 2021 (Q1-Q3) |
|---|---|---|---|---|---|---|
Wells |
1 |
658 |
-1.4% |
-9 |
30.0% |
152 |
JPMC |
1 |
804 |
16.0% |
111 |
15.2% |
106 |
BofA |
1 |
1015 |
-7.9% |
-87 |
4.0% |
39 |
TD |
1 |
249 |
10.1% |
23 |
14.0% |
31 |
Truist |
1 |
138 |
-10.1% |
-15 |
18.0% |
21 |
Regions |
1 |
84 |
3.7% |
3 |
-12.5% |
-12 |
U.S. Bank |
1 |
158 |
-1.5% |
-2 |
-7.7% |
-13 |
PNC |
1 |
176 |
26.4% |
37 |
39.0% |
50 |
Financial Institutions grouped according to 2021 Overdraft/NSF fee revenue
| Group by 2021 OD/NSF fee revenue | Number of Financial Institutions | Group Revenue ($M) through Q3 2022 | % Change vs. 2019 (Q1-Q3) | $ Change ($M) vs. 2019 (Q1-Q3) | % Change 2022 vs. 2021 (Q1-Q3) | $ Change ($M) 2022 vs. 2021 (Q1-Q3) |
|---|---|---|---|---|---|---|
50m to 200m |
10 |
414 |
-15.0% |
-73 |
-2.2% |
-9 |
10m to 50m |
47 |
388 |
-6.0% |
-25 |
4.5% |
17 |
2m to 10m |
123 |
220 |
12.1% |
24 |
7.9% |
16 |
Under 2m |
277 |
110 |
3.3% |
3 |
3.0% |
3 |
Individual Financial Institutions and Grouped Financial Institutions
| Institution | Number of Financial Institutions | Group Revenue ($M) through Q3 2022 | % Change vs. 2019 (Q1-Q3) | $ Change ($M) vs. 2019 (Q1-Q3) | % Change 2022 vs. 2021 (Q1-Q3) | $ Change ($M) 2022 vs. 2021 (Q1-Q3) |
|---|---|---|---|---|---|---|
Total |
465 |
4415 |
- |
-11 |
- |
399 |
Among the eight larger individual banks, compared to the pre-pandemic 2019 baseline, there was a divergence of experiences in other listed fee revenue. However, there is no clear correlation between decreases in overdraft/NSF and increases in other listed fee revenue. Of the three banks with the most significant declines in overdraft/NSF fee revenue since 2019, Bank of America’s other listed fee revenue dropped 7.9%, while PNC’s increased 26.4% and U.S. Bank’s decreased 1.5%. In terms of dollar amounts, the declines in overdraft/NSF fee revenue across all eight banks for the first nine months of 2022 ($2.2 billion) far exceeded the net increase in listed fee revenue ($61 million). Banks with $10 million to $50 million and banks with $50 million to $200 million in 2021 overdraft/NSF revenue on average reported less revenue from other listed fees than before the pandemic; in contrast, banks with $2 million to $10 million in 2021 overdraft/NSF revenue saw increases averaging 12.1%. Across all reporting banks, other listed fee revenue decreased by $11 million from 2019 to 2022, even as overdraft/NSF fee revenue decreased by $2.8 billion.
We will continue to track overdraft/NSF fees, and we are considering rulemaking activities related to these fees. We will also continue to follow other listed account fees to discern to what extent these fees might create barriers to account access.
For our latest review of overdraft/NSF policies, please see the most recent table tracking overdraft fees and policies across banks, as well as the most recent chart on NSF fee practices.
For further discussion of trends in these practices, see our February 2022 analysis, April 2022 analysis, and July 2022 analysis.
Endnotes
-
The data construction is the same as in our Dec 2021 report; please see that report for details. For the sample, we restrict attention to banks that reported listed fees during the first three quarters of 2022.
↩ -
We define two groups of small banks, those collecting under $2 million and those collecting $2 million to $10 million in overdraft/NSF fee revenue, and two groups of midsized banks, those collecting $10 million to $50 million and those collecting $50 million to $200 million in overdraft/NSF fee revenue in 2021.
↩ -
Since our focus is exclusively on fee revenues, we use this categorization as opposed to the more common categorization by asset size. This is because overdraft/NSF revenues and asset size are strongly but not perfectly correlated. This means that some banks that are categorized as midsize banks here based on their overdraft/NSF revenues may not be midsize based on their assets. Conversely, some banks that are categorized as small banks here based on their overdraft/NSF revenues may not be small based on their assets.
↩
Page last modified @