Housing inflation is hitting low-income renters
Inflation was higher over the last year than it’s been for nearly 40 years. Prices for many things have been rising. But not all prices rise at the same rate, so how someone experiences inflation depends on what they buy, how their income has changed, and what they own. This post considers one area where inflation experiences differ sharply: housing.
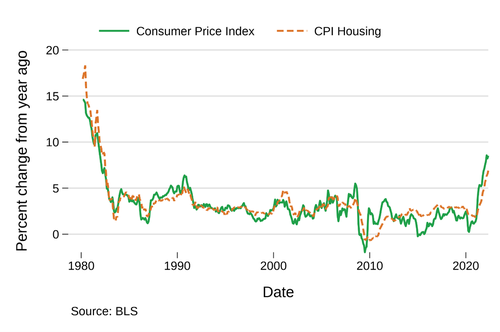
Figure 1: Inflation and housing costs have increased rapidly recently
Housing cost increases are a big part of recent inflation
On average, people spend about a third of their budget on housing. And housing—whether their mortgage or rent—is most people’s largest expense each month. Moreover, it is often very hard for people to adjust how much they pay for housing. So when the amount people pay each month for housing increases, people are often forced to make other hard adjustments.
Exactly because households typically spend the most on housing, the cost of housing has a large influence on inflation. Housing is the largest component in the bundle of goods and services that is used to calculate the Consumer Price Index (CPI), which is typically used to measure inflation. When housing costs go down, for example during the Great Recession, the CPI tends to fall. When they go up, as has happened recently, the CPI tends to increase. Figure 1 illustrates this tight relationship.
House prices and the housing costs used to calculate the CPI are distinct but closely related. House prices have increased by more than 20 percent over the last year , although the rate of increase has slowed in the last several months. The CPI’s shelter component is a weighted average of rental costs and “owners' equivalent rent of residences,” which is what the Bureau of Labor Statistics (BLS) calculates owners would be able to rent their houses for. The relationship between market rents, what a house would sell for, and “owners' equivalent rent” is not as tight as one might expect. But as house prices go up, “owners' equivalent rent” tends to also go up after a delay . Because of this delay, the CPI’s housing component may continue to rise even if house price increases slow.
But only some people’s housing costs have been rising
Housing has gotten more expensive over the last year, however we measure it. But not everyone experiences this increase in the same way. Consider three groups: people who own their houses, people who are trying to buy a house, and people who are renting.
Current homeowners
For existing homeowners, the rapid rise in house prices is generally good news. Higher sales prices generally mean housing wealth has increased, whether or not homeowners intend to sell. Meanwhile, except for adjustable-rate mortgage holders, monthly principal and interest payments should not change although taxes might increase. So most existing homeowners are paying about the same for a house that is now worth more (or could be rented for more, which is what the BLS is calculating).
For example, a house worth $500,000 in July 2021, somewhat more than the median , is now worth about $600,000. The assets of the family that owns that house have increased by $100,000 in just one year. Homeowners tend to be richer, whiter, and older than average, so the increase in house prices tends to benefit people who are already better off.
Potential homeowners
On the other hand, people who have just bought a house or are trying to buy are paying much more for the same house than they would have a year ago. In addition to higher house prices, mortgage interest rates have also been rising rapidly since December 2021. Putting these two elements together, recent or prospective homebuyers are often taking on larger mortgages and paying more in interest each month.
For example, a family that bought a house worth $500,000 in July 2021 would pay around $1,661 per month for a 30-year fixed mortgage using the average mortgage rates at the time and a 20 percent down payment. The same family buying the same house in July 2022 would end up paying $2,728 per month and would need to find an extra $20,000 to make a 20 percent down payment. People buying their first home tend to be younger and have less wealth than existing homeowners.
Renters
Finally, about one third of households rent and rental rates have increased substantially. The rental component of the CPI increased by 5.8 percent over the past year. The Zillow Observed Rent Index , which measures changes in the asking price of listed rentals, increased by 14 percent from $1,749 in June 2021 to $2,007 in June 2022. New rental listings were up even more sharply in some cities as landlords responded to tighter housing markets .
Renters tend to be either young professionals or families who are generally lower income. Rent increases are particularly difficult for these families because they are already typically paying a substantial portion of their income for housing .
These three groups illustrate how complex inflation’s impact is. One big group, existing homeowners, is benefiting from the recent inflation (although they are paying more for other things as well, so may or may not be better off depending on what else they buy and their incomes). But that leaves new or prospective buyers and renters generally worse off. And the people who are worse off are the least able to deal with it, making housing inflation particularly worrisome.
Low-income renters are starting to feel the pinch
We are already seeing some of the consequences. Through June 2021, pandemic aid and higher savings had generally improved renters’ financial situation, just as it had improved most peoples’. But as inflation picked up and pandemic aid ended, these trends started to reverse. Evictions have nearly returned to pre-pandemic levels partly because rents are rising so fast . Homelessness may also be increasing .
Figure 2: The credit card debt of low-income renters has increased rapidly in the last year
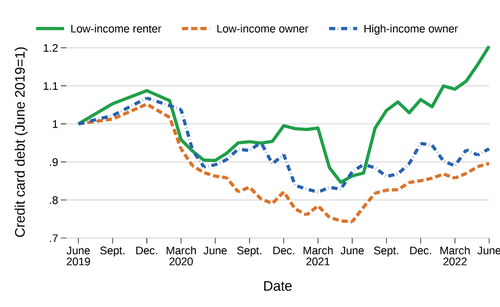
Indexed to June 2019, but not adjusted for inflation. Source: CFPB Making Ends Meet survey and CCP.
The credit card debt of low-income renters now exceeds its June 2019 level. Figure 2 shows three groups’ credit card debt (not adjusting for inflation): Low-income renters, defined as households whose income was $40,000 or less in 2018; low-income owners; and high-income owners. Renters, owners, and income are based on the CFPB’s June 2019 Making Ends Meet survey and their credit card debt in CFPB’s Consumer Credit Panel. While renting, owning, and income do change over time, the figure fixes the groups in 2019 so that the only thing changing is credit card debt, not who is included in which category. Using a survey makes it possible to look at specific groups.
Average credit card debt declined sharply early in the pandemic for all groups, including for people who were having financial difficulty before the pandemic. As Figure 2 shows, credit card debt declined again following the January and March 2021 Economic Impact Payments.
Beginning in June 2021, however, low-income renters’ credit card debt started increasing sharply and was up 39.4 percent over the year, much faster than inflation. Low-income renters’ average credit card debt increased by $532 during this period, a substantial amount given their income. By June 2022, their credit card debt was 20 percent higher than in June 2019. Meanwhile, homeowners’ credit card debt is still lower than before the pandemic and is increasing at about the same rate as inflation.
This rise in credit card debt suggests that general improvement in household finances from the pandemic may be coming to an end, or even reversing, for low-income renters as housing costs rise. One quarter of renters were already paying more than half their income for housing in 2020, before the recent rise in rent, so increasing credit card debt may be an early sign of financial trouble ahead.
The views expressed here are those of the authors and do not necessarily reflect the views of the Consumer Financial Protection Bureau. Links or citations in this post do not constitute an endorsement by the Bureau.