Credit card debt fell even for consumers who were having financial difficulties before the pandemic
In our first report from the Consumer Financial Protection Bureau’s Making Ends Meet survey, we showed that many consumers were financially vulnerable before the COVID-19 pandemic. In June 2019, 40 percent of consumers had difficulty paying a bill or expense in the previous year. Half could cover their expenses for two months or fewer if they lost their main source of income. Since then, the pandemic has left many consumers unemployed or with new expenses. When consumers have financial difficulty, they often borrow on credit cards to help make ends meet.
A key feature of the Making Ends Meet survey is that the consumers in the survey were drawn from credit bureau data, so that we can observe not only survey responses but also information about credit cards and other accounts. In this blog post, we use this feature of the data to ask whether financially vulnerable consumers have turned to credit card debt during the pandemic.
Credit card debt fell even for consumers who were having financial difficulties before the pandemic, rather than increasing as one might expect. The Bureau reported in August that average credit card debt fell sharply in the first few months of the pandemic. We find that this same trend holds for financially vulnerable consumers who might have been the first to turn to credit cards.
While these trends may be partially explained by changes in consumer spending, the fall in credit card debt suggests that the combination of federal and state policies—including unemployment insurance and stimulus checks—during the first months of the pandemic were effective at reaching financially vulnerable consumers. Many of these policies expired in July, and others will expire at the end of the year.
Data sources
To provide deeper insight into the sharp decline in credit card debt during the first few months of the pandemic, we use the Bureau’s Making Ends Meet survey to identify financially vulnerable consumers. The Bureau conducted the Making Ends Meet survey in May 2019, before the pandemic. The survey results are nationally representative of adults with a credit record and provide a deeper understanding of how consumers deal with financial difficulties. We reported some of our initial findings in July 2020 and examined consumer savings habits in September 2020.
A key advantage of the survey is that its sample is drawn from the Bureau’s Consumer Credit Panel, a deidentified sample of credit bureau records. This connection allows us to observe not just what respondents reported at the time of the survey, but also the information contained in their credit record before, during, and after the survey. For this post, we focus on credit card debt.
What is the Consumer Credit Panel?
Consumer reporting agencies collect information provided by lenders and others on, for example, the status of a consumer’s credit accounts and loan payment history. These agencies, in turn, provide credit reports based on this information. These credit reports are used in decisions about providing credit as well as in employment, rental, housing, and insurance decisions. The Consumer Credit Panel (CCP) is a sample of more than five million de-identified credit records from one of the three nationwide consumer reporting agencies. The information on each de-identified consumer in the CCP is updated regularly, so it is possible to observe how an individual’s credit use changes over time. The Bureau uses the CCP to inform research and policy on consumer credit markets.
Consumers who had difficulty paying bills and expenses
Figure 1: “At any time in the past 12 months have you or your household had difficulty paying for a bill or expense?” by credit score category
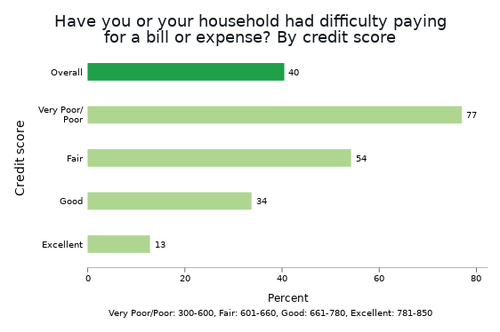
One approach we took to examining whether the pandemic had a disproportionate impact on financially vulnerable consumers was to look at consumers who had difficulty paying a bill or expense in the previous year. In June 2019, 40 percent of consumers fell into this category. Figure 1 shows the share of consumers who reported having difficulty and how the share varies by credit score. As one might expect, consumers with lower credit scores were much more likely to report having difficulty. The initial report goes into greater detail on the kinds of difficulties consumers have and their consequences.
Figure 2: Average credit card debt by whether respondent reported having “difficulty paying a bill or expense” in the 12 months before June 2019.
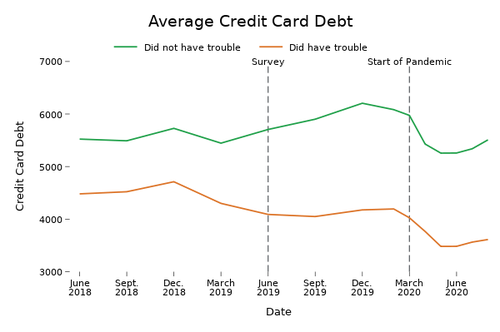
The credit card debt of both consumers who had difficulty before the pandemic and those who did not fell rapidly starting in March 2020. Figure 2 shows the average credit card debt (conditional on having a card) by whether the respondent reported having difficulty or not. From the end of February to the end of March 2020, there was a slight decline in credit card debt for both consumers who did and did not report having difficulty. Some of this decline might have been due to the normal seasonal variation. But our credit bureau data are reported near the end of the month, so the decline in March 2020 may also reflect several weeks of the pandemic. Many states issued stay-at-home orders and other restrictions starting in the middle of the March. There was a steep decline in average credit card debt for both groups over April and May 2020 that was much larger than the decline over the same period in the previous year.
The relative decline for both groups was fairly similar. From the end of February to the end of June 2020, credit card debt fell by $825 dollars for the group who did not report having difficulty and $711 dollars for the group that did. But the group without difficulty had more credit card debt to start with, so the decline was proportionally slightly larger for consumers who did report having difficulty (17.0 percent) than the decline for consumers who did not report having difficulty (13.6 percent).
Consumers who could cover two months or fewer of expenses
Figure 3: “If your household lost its main source of income, about how long could you cover expenses by, for example, borrowing, using savings, selling assets, or seeking help from family or friends?”
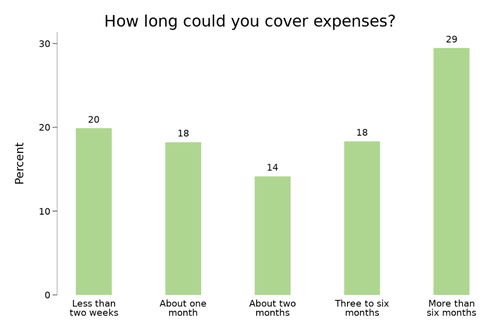
Our initial report also showed that many consumers were unprepared to weather even a short income drop. As Figure 3 shows, 38 percent of consumers reported that they would be able to cover expenses for fewer than two months if they lost their main source of income using all available sources of funds, including borrowing. These consumers may not be having financial difficulty but are potentially at risk from an unexpected expense or income fall.
Figure 4: Average credit card debt by whether respondent reported being able to cover less than two months of expenses (low liquidity) or two months or more (high liquidity).
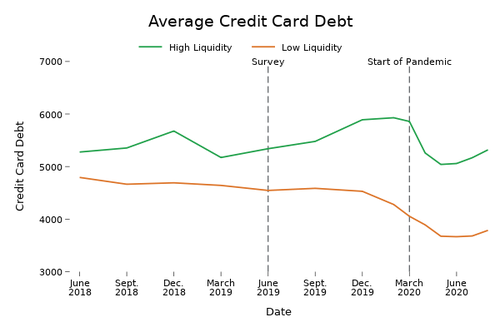
Dividing consumers by whether they reported having low liquidity (could cover less than two months of expenses) or high liquidity (could cover two months or more), Figure 4 shows that the average credit card debt declined for both groups at the start of the pandemic. From the end of February to the end of June 2020, credit card debt fell by $871 dollars for the high-liquidity group and $612 dollars for the low-liquidity group. Proportionally, credit card debt declined by 14.7 percent for the high-liquidity group and 14.3 percent for the low-liquidity group.
The decline in debt for the low-liquidity group is a bit smaller in dollar terms and proportionally than for the group who had difficulty in Figure 2. The low-liquidity group also does not have the holiday debt bump displayed by other groups in December 2018 and December 2019. A possible explanation for the lack of bump and the smaller decline, which is consistent with other Bureau research, is that low-liquidity consumers have more difficulty adjusting their spending through the year or in response to shocks. Yet the decline is only slightly smaller, so even consumers with low-liquidity before the pandemic were able to reduce credit card debt substantially rather than increase it.
Discussion
What caused the decline in credit card debt? Our data do not let us determine the answer with certainty, but we can consider some possibilities:
- The Economic Impact Payments and expanded $600 unemployment insurance provided by the CARES Act started in April and May. Other analysis has shown that these payments supported spending by unemployed households.
- Consumerspending declined substantially starting in March. The decline in spending and the income support meant that the personal saving rate increased. Credit card debt reflects both current spending and accumulated balances from previous purchases. Credit card holders typically use their cards for 17 percent of overall purchases each month , although that percentage may have increased as spending shifts online . As consumers spend less, their credit card balances from transactions decline. Meanwhile, half of consumers with a credit card revolve debt. Debt paydowns are a way for households with additional cash to reduce their ongoing liabilities and interest payments.
Judging by the decline in credit card debt, these policies and changes in consumer spending appear to have reached consumers who were financially vulnerable before the pandemic.
Many of these policies ended in July or will expire at the end of the year. Credit card debt in Figures 2 and 4 started to increase for all groups in August. Other research has shown that savings declined in August as well.
Other Bureau analysis
The Bureau is committed to understanding the pandemic’s impact on consumers. The Bureau conducted a follow-up survey in May and June 2020 and expects to do additional analysis of how consumers are dealing with the financial impacts of the pandemic. Other research by the Bureau on the pandemic’s effects on consumers include:
- A report on The Early Effects of the COVID-19 Pandemic on Credit Applications describing the fall in credit in credit inquiries during the first months of the pandemic.
- A report on The Early Effects of the COVID-19 Pandemic on Consumer Credit describing the changes in consumer credit through July 2020.