Credit card use is still declining compared to pre-pandemic levels
This post is the third in a series documenting trends in consumer credit outcomes during the COVID-19 pandemic. Last August, we published a report on early trends in consumer credit outcomes through June 2020, which found largely positive trends despite widespread economic disruption due to the pandemic. See here for the first post in the series.
This post focuses on how trends in credit card balances have evolved since June 2020. Simple economic theory says that, all else equal, it would be rational for consumers to take on debt when their income take a hit, but evidence of this is mixed . Moreover, for most of the pandemic, aggregate personal income rose above the pre-pandemic trend . In the August 2020 report we found that credit card balances were down on average in the early months of the pandemic, and also that credit card balances declined in every sub-group we examined. Since July, these trends have continued, with credit card balances continuing to fall compared to the same month a year prior, both overall and in each sub-group.
As in previous posts in this series, we use the Bureau’s Consumer Credit Panel (CCP), a de-identified sample of records from one of the three nationwide consumer reporting agencies. We also use data from the Board of Governors of the Federal Reserve System's Y-14M Credit Card data collection, which includes de-identified monthly level data for credit card issuers with assets exceeding $50 billion and accounted for just under 70 percent of outstanding credit card balances as of year-end 2020.
Average credit card balances have continued to decline during the COVID-19 Pandemic
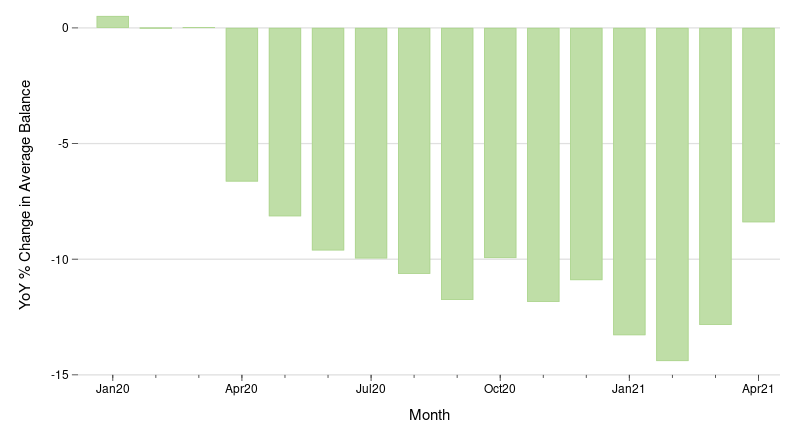
The figure above plots the year-over-year change in the average balance across all general-purpose credit card accounts in the CCP. The average credit card account balance fell dramatically in the early months of the pandemic for all groups, and there is no evidence of a sustained increase since June of 2020. By March of 2021, average credit card balances were almost 13 percent lower compared to one year earlier in March 2020. Average balances were about 8 percent lower in April 2021 compared to April 2020, despite average balances in April 2020 already being substantially lower compared to April 2019. It has been well documented elsewhere that consumer spending has declined overall, but that the decline in spending has not been equal across high- and low-income households. It is possible that the overall decline in balances shown above reflects reductions in spending among employed consumers and masks increases in balances for those who became unemployed. However, the trends in credit card balances were similar for consumers in counties with both large and small increases in unemployment during the pandemic. Indeed, the credit card balances of consumers residing in counties with the largest increases in unemployment were about 14 percent lower in March 2021 compared to March 2020, whereas for consumers residing in counties with the smallest changes in unemployment, credit card balances declined by about 11 percent (not shown). Breaking down the change in average balances by other groupings, including census tract racial and ethnic composition, census tract income, county-level COVID-19 case rates, and pre-pandemic credit score all show essentially the same trends as in the figure above—a pronounced drop in the early months of the pandemic and a continued decline since July of 2020.
Credit Utilization Rates Have Declined During the Pandemic
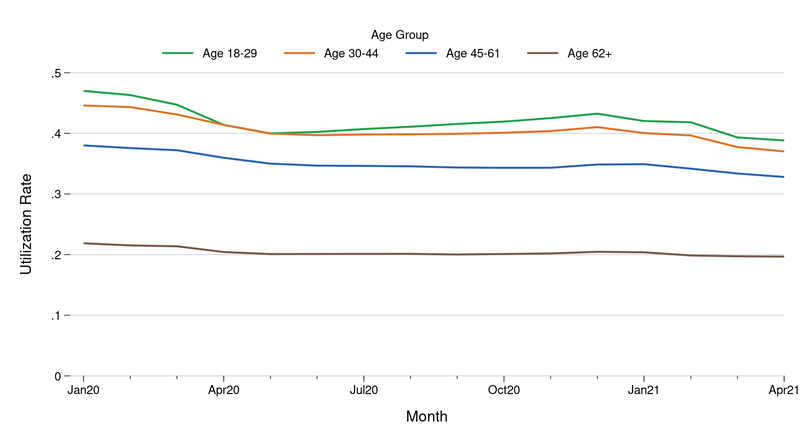
The figure above plots the average credit card utilization rate—total balances on all cards divided by total credit limit on all cards—from January 2020 through April 2021 broken out by the consumers’ age in 2019. Credit card utilization was higher for younger borrowers age 18-29 throughout the period, reflecting generally lower average credit limits for that group. However, for all groups the average utilization rate declined substantially in the early months of the pandemic. Utilization rates remained low through April 2021, with only a small seasonal increase around the December holidays, followed by continued decreases in 2021. To some extent this decrease in utilization rates is to be expected, given the decrease in average balances documented above. However, this decrease is remarkable given that prior research has shown that utilization rates are remarkably consistent over time: even during the depths of the Great Recession, with huge shocks to income and reductions in access to credit, average utilization rates were essentially unchanged. In addition, this drop in utilization rates is important all by itself, because utilization rates are a factor in the calculation of credit scores.
During the Pandemic, Fewer Consumers Used Credit Cards for Borrowing
Credit card balances alone do not tell the full story of how consumers are using revolving credit. For consumers who pay their balances in full every month, lower balances simply mean less spending, but if more consumers are instead carrying a balance month to month, that could indicate the potential for financial distress. The CCP does not have sufficient information to determine whether consumers pay their balances in full each month, so we turn to the Y-14M data.
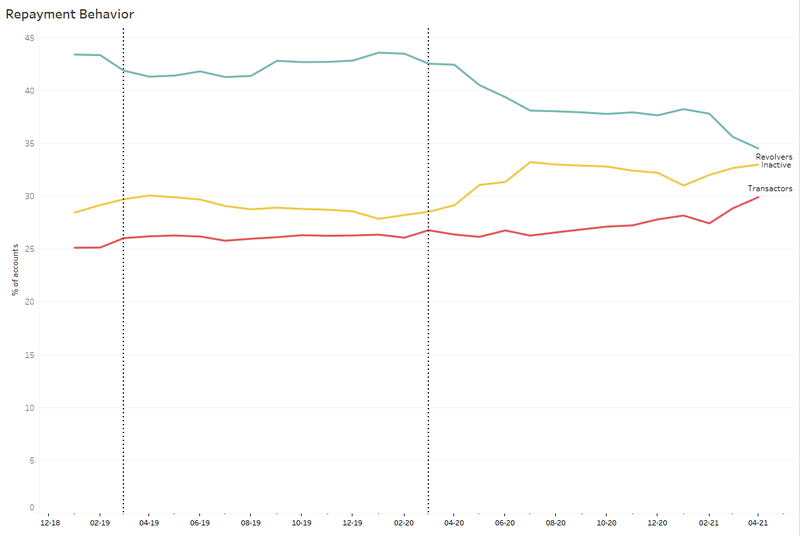
The figure above shows the share of general purpose credit card accounts that were paid in full (“transactors”), the share that had some unpaid balance (“revolvers”), and the share that had no balance at all (“inactive”), from January 2019 through March of 2021. The share of revolver accounts declined from around 43 percent to 38 percent in the early months of the pandemic and continued to decline through April of 2021, reaching 34 percent. Many of these accounts seem to have transitioned to being inactive, as the share of transactors was relatively stable over the same period, although it has been climbing in recent months. At the same time, there was no increase in the share of accounts paying only the minimum payment, whether revolving or transacting (not shown). Against this backdrop, the Y-14 data show an initial decline in purchase activity starting in April of 2020 and a subsequent steady increase throughout the remainder of 2020, back to pre-pandemic level. So, even though the share of revolving accounts declined, and the share of inactive accounts increased, the recovery in purchase activity indicates that those accounts that remained active were used with greater intensity through April of 2021.
What’s Next?
The CCP and Y-14M data cannot directly capture whether consumers who have been hit hard by the pandemic are accumulating credit card debt. However, previous work by Bureau researchers has found that even consumers who were experiencing financial difficulties before the pandemic reduced their credit card balances during the early months of the pandemic. If consumers are turning to credit card debt to supplement lost income due COVID-19, it is not occurring in a widespread manner that is showing up in the data. As we have discussed in previous posts in this series, that may change as programs providing payment assistance and stimulus payments end or are phased out. In the next post in this series, we will discuss trends in credit limits and the availability of credit on existing credit card accounts. You can find the previous posts in the series here and here.