Office of Research blog: Update on student loan borrowers as payment suspension set to expire
The pause on federal student loan interest, payments, and collections is now scheduled to end 60 days after June 30th, which means borrowers will have to start making payments soon. In April 2022, we provided an overview of the credit health of student loan borrowers during the first two years of the payment pause. And in an update late last year, we showed that student loan borrowers were increasingly likely to struggle with payments on their other debts. We have continued to monitor the situation to better understand how borrowers may fare when payments resume and where further support may be needed.
In this post, we provide a new update showing:
- More than one-in-thirteen student loan borrowers are currently behind on their other payment obligations. These delinquencies are higher than they were before the pandemic, despite a small seasonal decrease in the most recent data.
- About one-in-five student loan borrowers have risk factors that suggest they could struggle when scheduled payments resume.
- Median scheduled payments on other debt obligations have increased by 24 percent for student loan borrowers likely returning to repayment. In percentage terms, these increases are especially large for younger borrowers (252 percent, or $65 to $229).
- More than four-in-ten borrowers in our sample will return to repayment with a new student loan servicer.
Delinquencies on non-student-loan credit increase to new levels
Using the Consumer Financial Protection Bureau’s (CFPB) Consumer Credit Panel (CCP), a deidentified sample of credit records from one of the nationwide consumer reporting agencies, we analyzed the credit histories of consumers expected to return to repayment by the end of the summer. We define these consumers as those who prior to the payment suspension: (1) had a student loan balance, (2) had at least one student loan not in default, and (3) were not reported as in repayment with a $0 scheduled monthly payment. We exclude consumers who did not have outstanding student loan balances reported at the end of March 2023, such as those who have received Public Service Loan Forgiveness discharges or paid off their student loans. (For more information on the student loan borrowers excluded from this analysis, see the April 2022 report and the November 2022 update.) The remaining sample represents about 32 million student loan borrowers whose federal student loans will begin accruing interest again, some of whom may have scheduled payments on those loans due by the end of the summer.
In our previous research, we discussed an initial decrease in non-student loan delinquencies for the first few months of the payment pause, with delinquencies remaining low until mid-2021 as other policy interventions, such as stimulus payments, helped people cope with financial difficulties due to the pandemic. However, as those policies expired, the percentage of student loan borrowers with non-student loan delinquencies began to rise, and in August 2022, surpassed the pre-pandemic share. Since then, this fraction continued to increase until March 2023 when it decreased for the first time in a year, as seen in Figure 1.
Figure 1
Percent of student loan borrowers in sample 60+ days delinquent on other credit products
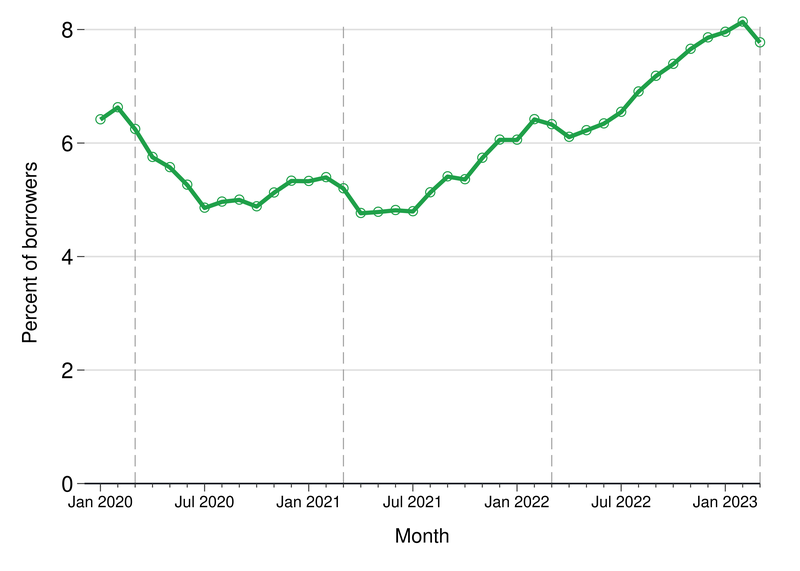
Source: CFPB CCP.
While it is possible this decrease represents a new trend, we do not think it signals improving conditions for these borrowers. Figure 1 shows that the percentage of student loan borrowers with delinquencies on other credit products decreased every March (as noted in the dashed vertical lines), part of a general pattern of seasonal increases in this measure at the end of the year that briefly reverses around March. This is largely driven by seasonal changes in delinquencies on general-purpose credit cards (not shown). Previous CFPB research on credit card balances and delinquencies found a similar seasonal pattern prior to the pandemic and briefly discussed a possible relationship with tax refunds and debt repayment.
Delinquencies on non-student loan products are up by more than half a percentage point since our last update. As of March 2023, around 2.5 million student loan borrowers had a delinquency on a non-student loan, an increase of around 200,000 borrowers since September 2022. As seen in Table 1, delinquencies on non-student-loans increased for all groups of borrowers, with particularly large increases for borrowers ages 30 to 49, borrowers who live in higher-income areas, and borrowers with student loan balances above $35,000. For example, borrowers ages 30 to 49 already had a higher rate of delinquencies on non-student loan products than younger or older borrowers in our earlier analyses, and this gap widened further in the most recent data. In contrast, while borrowers in moderate- or higher-income Census tracts are less likely overall to have a non-student-loan delinquency than borrowers in lower-income Census tracts, these delinquencies grew faster for borrowers in higher-income areas over the last several months. Finally, as seen in prior updates, borrowers with larger student loan balances are still more likely to have a delinquency on a non-student loan account than borrowers with smaller student loan balances, and this gap has widened slightly. Borrowers with large balances relative to their income may find their scheduled monthly student loan payments especially difficult to manage if they are not enrolled in income-driven repayment (IDR) plans when the payment pause ends.
Student loan borrowers who are already having difficulty with their other payment obligations are especially likely to struggle with their student loan payments if they don’t get some sort of payment relief like enrolling in an IDR plan. As noted in our first report, delinquencies on other debts were associated with student loan delinquencies prior to the pandemic, and this is unlikely to have changed in the last three years. Additionally, prior research has shown that a lot of borrowers deprioritize their student loan payments relative to other debts, suggesting that some borrowers who are struggling but not currently behind on other payments may still struggle with the return of their student loan payments.
Table 1
Delinquencies on non-student-loans for student loan (SL) borrowers
| - | Active delinquency, Sep. 2022 (%) | Active delinquency, Mar. 2023 (%) | Share with two or more risk factors, Mar. 2023 (%) | Share (%) |
|---|---|---|---|---|
Overall |
7.2 |
7.8 |
18.5 |
100 |
Prior SL delinquency |
- |
- |
- |
- |
Never in repayment |
6.4 |
6.9 |
7.9 |
18 |
Delinquent |
14.6 |
15.3 |
75.1 |
7 |
Not delinquent |
6.7 |
7.3 |
15.8 |
75 |
Census tract income |
- |
- |
- |
- |
Low |
10.8 |
11.2 |
23.9 |
18 |
Moderate |
7.7 |
8.3 |
19.2 |
42 |
High |
5.0 |
5.6 |
15.3 |
40 |
Age |
- |
- |
- |
- |
18-29 |
5.5 |
6.0 |
15.0 |
33 |
30-49 |
8.7 |
9.5 |
22.3 |
47 |
50+ |
6.4 |
6.8 |
15.3 |
20 |
SL balances |
- |
- |
- |
- |
Less than $10,000 |
7.1 |
7.5 |
14.4 |
24 |
$10,000-$19,999 |
7.1 |
7.7 |
15.8 |
18 |
$20,000-$34,999 |
6.7 |
7.0 |
16.1 |
19 |
$35,000-$49,999 |
7.7 |
8.4 |
21.2 |
11 |
$50,000 or more |
7.4 |
8.3 |
24.7 |
27 |
Note: All statistics are calculated for student loan borrowers who may have a payment due when the suspension ends and who had an outstanding student loan in February 2020. Active delinquencies are for accounts 60 days or more past due (but not charged-off or in collections). Prior student loan delinquency is defined as having a student loan in February 2020 reported as 90 days or more past due while those classified as never in repayment have no reported prior payments as of February 2020. Census tract categories are defined by adults in the tract with household income below 200 percent of the federal poverty threshold; “low” income is 40 percent or more of adults, “moderate” income is 20 percent or more but less than 40 percent of adults, and “high” income is less than 20 percent of adults. Student loan balances are as of September 2022 in the first column, and as of February 2023 in the other columns. Active delinquencies for September 2022 differ slightly here from our last update because some borrowers who still had loans in our last update no longer have outstanding balances.
Source: CFPB CCP.
Last year, we also identified five potential risk factors that may be indicative of student loan borrowers who might struggle when the payment suspension ends: 1) pre-pandemic delinquencies on student loans, 2) pre-pandemic payment assistance on student loans, 3) multiple student loan servicers, 4) delinquencies on other credit products since the start of the pandemic, and 5) new non-medical collections during the pandemic. In our initial report, we estimated there were 5.1 million student loan borrowers with two or more of these risk factors. But with rising delinquencies on non-student loan accounts and new non-medical collections (not shown), this has increased to 5.9 million student loan borrowers. This highlights that an even larger group of borrowers—beyond just those who are delinquent on other debts—are likely to struggle when payments resume.
Larger non-student-loan debts and transfers to new servicers could complicate transition to repayment for millions of borrowers
The share of student loan borrowers with higher monthly non-student loan payments has also continued to rise since our last update. Now half of all borrowers expected to return to repayment have scheduled monthly payments for non-student loan, non-mortgage debts that are at least 10 percent higher than they were before the payment suspension began (shown in Table 2). Overall, there has been a 24 percent increase in median monthly payments on non-student-loan debts for student loan borrowers in our sample since the start of the pandemic. Balances have increased for a variety of credit products, including credit cards and auto loans , but rising interest rates also mean that larger loan amounts and balances will result in higher monthly payments.
Table 2
Payment and risk factor status for student loan (SL) borrowers, March 2023
| - | Median scheduled non-SL, non-mortgage payments, Mar. 2023 ($) | Share with over 10% increase in scheduled non-SL, non-mortgage payments, Mar. 2020-Mar. 2023 (%) | Increase in median scheduled non-SL, non-mortgage payments, Mar. 2020-Mar. 2023 (%) |
|---|---|---|---|
Overall |
428 |
50 |
24 |
Prior SL delinquency |
- |
- |
- |
Never in repayment |
194 |
58 |
341 |
Delinquent |
273 |
47 |
48 |
Not delinquent |
493 |
49 |
15 |
Census tract income |
- |
- |
- |
Low |
355 |
51 |
57 |
Moderate |
435 |
51 |
25 |
High |
455 |
49 |
15 |
Age |
- |
- |
- |
18-29 |
229 |
59 |
252 |
30-49 |
538 |
50 |
16 |
50+ |
556 |
37 |
-12 |
SL balances |
- |
- |
- |
Less than $10,000 |
390 |
48 |
21 |
$10,000-$19,999 |
375 |
50 |
32 |
$20,000-$34,999 |
374 |
53 |
43 |
$35,000-$49,999 |
463 |
51 |
22 |
$50,000 or more |
530 |
51 |
18 |
Note: All statistics are calculated for student loan borrowers who may have a payment due when the suspension ends and who had an outstanding student loan in February 2020. Scheduled payments include all minimum scheduled monthly payment amounts for all credit products other than student loans and mortgages. Prior student loan delinquency is defined as having a student loan in February 2020 reported as 90 days or more past due while those classified as never in repayment have no reported prior payments as of February 2020. Census tract categories are defined by adults in the tract with household income below 200 percent of the federal poverty threshold; “low” income is 40 percent or more of adults, “moderate” income is 20 percent or more but less than 40 percent of adults, and “high” income is less than 20 percent of adults.
Source: CFPB CCP.
This increase in monthly payments is especially pronounced for younger borrowers (252 percent increase in median) and those who had not yet been in repayment prior to the start of the payment suspension (341 percent increase in median). For borrowers who left school and exhausted their six-month grace period during the pause, the transition into student loan repayment for the first time may be difficult, especially if they have taken on other debts without previously needing to manage their student loan payments. Many of these student loan borrowers had low (or $0) non-student loan, non-mortgage monthly payments in March 2020, but the typical younger student loan borrower now has other debt payments of more than $200. The median older borrower, in contrast, had a lower non-student loan, non-mortgage monthly payment in March 2023 than they did in March 2020, but they still have payments more than twice as high as younger student loan borrowers.
Other factors could also pose challenges for borrowers returning to repayment. Over the last three years, several large servicers have exited their contracts with the Department of Education , which has resulted in large numbers of loan transfers. This change could complicate the transition to repayment for the 44 percent (or more than 14 million) of borrowers in our sample who will have to work with at least one new servicer after more than three years of suspended payments. So far, more than 17 million accounts for federal student loans have been transferred, and more transfers—either to different servicers or different servicing technology platforms—are expected in the coming months, ultimately reaching more than 30 million accounts. For some borrowers, this process may be smooth with few changes. But other borrowers may need to create new logins with their new servicer, re-enroll in autopay, or update their payment information.
The CFPB Office of Research will continue monitoring borrowers’ repayment performance over the coming months to observe whether these risks materialize into financial distress and to understand where further support may be needed.