Credit applications remain depressed for credit cards and auto loans
During the month of March, credit applications for auto loans, mortgages, and credit cards fell by 30 to 50 percent as we reported in a May report . We extend the credit applications series in this blog post through September to better understand how consumer credit markets have evolved in response to the pandemic. We find that consumer credit markets are still far from normal. Credit card inquiries were still 30 percent below their pre-pandemic levels in September. Inquiries for auto loans returned to pre-pandemic levels in June but slipped between then and September. However, inquiries for new mortgages have more than recovered since May.
The analysis in this blog follows the original May report . We use the Bureau’s Consumer Credit Panel (CCP), a deidentified sample of credit bureau records. As in the original report, we show how the actual volume of inquiries compare to the usual volume of inquiries predicted based on historical seasonal trends and observed inquiry volumes in the first week of March. The original report contains additional details on the methodology.
What is a credit application or inquiry?
When a consumer applies for new credit to purchase a car or a home or for a new credit card account, most lenders will seek information about the consumer from a nationwide consumer reporting agency. This is often referred to as a “hard inquiry.” Reductions in hard inquiries may represent a fall in credit demand as consumers make fewer purchases, seek less credit for purchases they do make, or don’t think they will be approved for credit. Reductions in hard inquiries may also represent a change in credit supply as creditors change the terms of credit, advertise less, or make fewer credit offers.

Figure 1: Percentage change in credit inquiries relative to the first week of March by week ending date by inquiry category (adjusted based on historical seasonal trends)
Analysis by credit type
Figure 1 updates the same figure in the original report through September for the four types of credit inquiries considered: auto loan, new mortgage, revolving credit card, and unspecified and other (including personal loans and revolving loans). While the volume of inquiries declined in all categories in March as documented in the original report, their subsequent path was quite distinct. Auto loan inquiries experienced the largest drop by the last week of March at 52.4 percent. Auto loan inquiries recovered starting in mid-April: by the week ending May 22 they were only 9.8 percent below their usual volume, and by the week ending June 19 they were just 2.5 percent below their usual volume. In July and August auto loan inquiries experienced a drop relative to their usual volume with the last week of August showing a 21.6 percent shortfall compared to their usual volume.
As shown in the original report, new mortgage inquiries experienced a smaller drop by the last week of March at 26.9 percent. New mortgage inquiries remained depressed through mid-April, but then the volume of new mortgage inquiries showed a pronounced recovery. They exceeded their usual volume in early May and stayed about 20 percent above the usual volume throughout the summer. Some of this increase is likely accounted for by pent-up demand for mortgages, but the overall increase is too large and long lasting for this to be the only source of increase.
Unlike auto loan or new mortgage inquiries, revolving credit card inquiries did not recover much after March. Their volume dropped by 39.7 percent by the last week of March and declined further reaching a 48.7 percent below their usual volume by early June. After that date, revolving credit card inquiries recovered some, but even during the last week depicted (ending on September 11), they were 30.4 percent below their usual volume. These changes in credit card inquiries took place while credit limits on existing credit cards declined slightly and the closure of accounts by credit card issuers showed an uptick during the pandemic, as documented in our August report on consumer credit. Finally, inquiries for unspecified and other types of loans followed a similar path to revolving credit card inquiries through mid-April but then recovered somewhat more and reached 17.2 percent below their usual volume by the last week depicted.
Analysis by credit score
Next, we examine the patterns in more detail by credit score. We use VantageScore, a credit score that was developed by the three national credit reporting companies, as our measure of a consumer’s creditworthiness and define credit score groups as deep subprime (score below 5oo), subprime (score between 500 and 600), near prime (score between 601 and 660), prime (score between 661 and 780), and super prime (score above 780).
Figure 2 shows the percentage change in auto loan inquiries by week across the credit score groups relative to the first week of March. The percentage changes in inquiry volumes for all credit score groups followed patterns comparable to the overall one in Figure 1, with inquiries dropping somewhat more for consumers with super prime scores than for other groups. The percentage changes in inquiry volume for the other four credit score groups moved very similarly to each other through the spring.

Figure 2: Percentage change in auto loan inquiries relative to the first week of March by week by credit score group (adjusted based on historical seasonal trends)
Inquiries by consumers with deep subprime scores jumped markedly during the week ending on April 17, coinciding with the receipt of the first CARES Act Economic Impact Payments. During the summer, the recovery for consumers with deep subprime scores was weaker than that for the other groups. By the last week of August, consumers with deep subprime scores (the group with the largest decline) were 28.7 percent below their usual volume while consumers with near prime scores (the group with the smallest decline) were 17.7 percent below their usual volume. These patterns likely reflect a combination of factors related to differential income change during the pandemic, differential access to credit, and differential demand for cars in light of many consumers working from home. During the last week of available data, the highest three credit score groups experienced a notable upturn in inquiries relative to their usual volume. (It is notable that Labor Day fell on the last week of available data only in two years, in 2013 and in 2020. Since Labor Day affects school starts and may affect auto shopping behavior itself, this timing may explain some of the observed fluctuations at the end of the series. In contrast, Memorial Day and Independence Day fell on the same week in each year considered.)
Figure 3 shows the percentage change in new mortgage inquiries by week across the credit score groups relative to the first week of March. Again, all credit score groups followed patterns comparable to the overall one in Figure 1, with consumers with super prime scores experiencing a larger drop in inquiries than the other groups. The differences among the credit score groups are more pronounced than for auto loan inquiries, however. New mortgage inquiries dropped most for consumers with super prime scores throughout the period. Unlike for auto loan inquiries, consumers with deep subprime scores had the largest percentage increase in inquiries compared to their usual volume. (It is notable, though, that consumers with deep subprime scores account only for 2.7 percent of new mortgage inquiries while they account for 11 percent of auto loan inquiries and over 8 percent of credit card inquiries.)
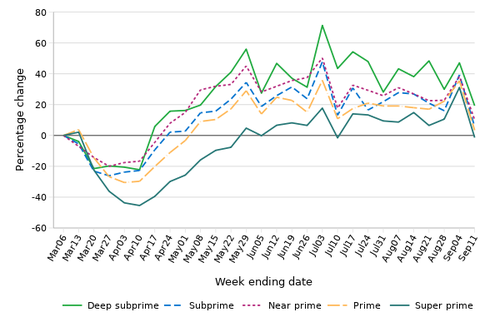
Figure 3: Percentage change in new mortgage inquiries relative to the first week of March by week by credit score group (adjusted based on historical seasonal trends)
Similar to auto loan inquiries, new mortgage inquiries jumped markedly for consumers with deep subprime scores during the week coinciding with the receipt of the first CARES Act Economic Impact Payments. In addition, inquiries compared to usual volumes increased significantly for all groups around Memorial Day and Independence Day, but not around Labor Day. By the last week depicted, all groups were at or somewhat above their usual volume. Again, these patterns likely reflect a combination of factors related to differential income change during the pandemic, differential access to credit, and differential demand for housing.
Finally, Figure 4 shows the percentage change in credit card inquiries compared to usual volumes by week across the credit score groups relative to the first week of March. Again, all credit score groups followed patterns comparable to the overall one in Figure 1. The differences among the groups are again more pronounced than for auto loan inquiries. The percentage drops in inquiries compared to their usual volume were largest for consumers with super prime scores and smallest for consumers with deep subprime scores.
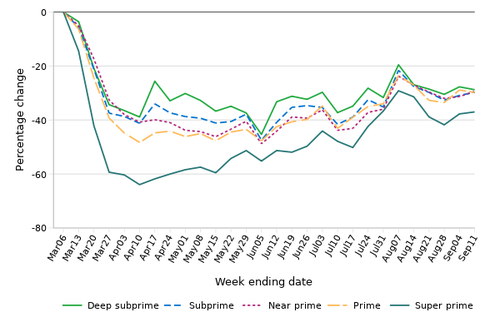
Figure 4: Percentage change in revolving credit card inquiries relative to the first week of March by week by credit score group (adjusted based on historical seasonal trends)
Credit card inquiries by consumers with deep subprime scores (and to some extent those with subprime scores) jumped markedly during the week coinciding with the receipt of the first CARES Act Economic Impact Payments. By the last week depicted, inquiries for all groups were slightly less than 30 percent below their usual volume, with the exception of consumers with super prime scores (whose inquiry volumes were 37 percent below their usual volume). The larger drop in revolving credit card inquiries for consumers with super prime scores may reflect the fact that most of this group’s revolving credit card demand can be attributed to transactional demand. This is in alignment with the finding of our recent blog post that showed that both low- and high-liquidity consumers experienced a drop in credit card debt during the pandemic with the dollar value of the drop larger for the high-liquidity group.