Social Security Offsets and Defaulted Student Loans
Executive Summary
When borrowers default on their federal student loans, the U.S. Department of Education (“Department of Education”) can collect the outstanding balance through forced collections, including the offset of tax refunds and Social Security benefits and the garnishment of wages. At the beginning of the COVID-19 pandemic, the Department of Education paused collections on defaulted federal student loans.1 This year, collections are set to resume and almost 6 million student loan borrowers with loans in default will again be subject to the Department of Education’s forced collection of their tax refunds, wages, and Social Security benefits.2 Among the borrowers who are likely to experience forced collections are an estimated 452,000 borrowers ages 62 and older with defaulted loans who are likely receiving Social Security benefits.3
This spotlight describes the circumstances and experiences of student loan borrowers affected by the forced collection of Social Security benefits.4 It also describes how forced collections can push older borrowers into poverty, undermining the purpose of the Social Security program.5
Key findings
- The number of Social Security beneficiaries experiencing forced collection grew by more than 3,000 percent in fewer than 20 years; the count is likely to grow as the age of student loan borrowers trends older. Between 2001 and 2019, the number of Social Security beneficiaries experiencing reduced benefits due to forced collection increased from approximately 6,200 to 192,300. This exponential growth is likely driven by older borrowers who make up an increasingly large share of the federal student loan portfolio. The number of student loan borrowers ages 62 and older increased by 59 percent from 1.7 million in 2017 to 2.7 million in 2023, compared to a 1 percent decline among borrowers under the age of 62.
- The total amount of Social Security benefits the Department of Education collected between 2001 and 2019 through the offset program increased from $16.2 million to $429.7 million. Despite the exponential increase in collections from Social Security, the majority of money the Department of Education has collected has been applied to interest and fees and has not affected borrowers’ principal amount owed. Furthermore, between 2016 and 2019, the Department of the Treasury’s fees alone accounted for nearly 10 percent of the average borrower’s lost Social Security benefits.
- More than one in three Social Security recipients with student loans are reliant on Social Security payments, meaning forced collections could significantly imperil their financial well-being. Approximately 37 percent of the 1.3 million Social Security beneficiaries with student loans rely on modest payments, an average monthly benefit of $1,523, for 90 percent of their income. This population is particularly vulnerable to reduction in their benefits especially if benefits are offset year-round. In 2019, the average annual amount collected from individual beneficiaries was $2,232 ($186 per month).
- The physical well-being of half of Social Security beneficiaries with student loans in default may be at risk. Half of Social Security beneficiaries with student loans in default and collections skipped a doctor’s visit or did not obtain prescription medication due to cost.
- Existing minimum income protections fail to protect student loan borrowers with Social Security against financial hardship. Currently, only $750 per month of Social Security income—an amount that is $400 below the monthly poverty threshold for an individual and has not been adjusted for inflation since 1996—is protected from forced collections by statute. Even if the minimum protected income was adjusted for inflation, beneficiaries would likely still experience hardship, such as food insecurity and problems paying utility bills. A higher threshold could protect borrowers against hardship more effectively. The CFPB found that for 87 percent of student loan borrowers who receive Social Security, their benefit amount is below 225 percent of the federal poverty level (FPL), an income level at which people are as likely to experience material hardship as those with incomes below the federal poverty level.
- Large shares of Social Security beneficiaries affected by forced collections may be eligible for relief or outright loan cancellation, yet they are unable to access these benefits, possibly due to insufficient automation or borrowers’ cognitive and physical decline. As many as eight in ten Social Security beneficiaries with loans in default may be eligible to suspend or reduce forced collections due to financial hardship. Moreover, one in five Social Security beneficiaries may be eligible for discharge of their loans due to a disability. Yet these individuals are not accessing such relief because the Department of Education’s data matching process insufficiently identifies those who may be eligible.
Taken together, these findings suggest that the Department of Education’s forced collections of Social Security benefits increasingly interfere with Social Security’s longstanding purpose of protecting its beneficiaries from poverty and financial instability.
Introduction
When borrowers default on their federal student loans, the Department of Education can collect the outstanding balance through forced collections, including the offset of tax refunds and Social Security benefits, and the garnishment of wages. At the beginning of the COVID-19 pandemic, the Department of Education paused collections on defaulted federal student loans. This year, collections are set to resume and almost 6 million student loan borrowers with loans in default will again be subject to the Department of Education’s forced collection of their tax refunds, wages, and Social Security benefits.6
Among the borrowers who are likely to experience the Department of Education’s renewed forced collections are an estimated 452,000 borrowers with defaulted loans who are ages 62 and older and who are likely receiving Social Security benefits.7 Congress created the Social Security program in 1935 to provide a basic level of income that protects insured workers and their families from poverty due to situations including old age, widowhood, or disability.8 The Social Security Administration calls the program “one of the most successful anti-poverty programs in our nation's history.”9 In 2022, Social Security lifted over 29 million Americans from poverty, including retirees, disabled adults, and their spouses and dependents.10 Congress has recognized the importance of securing the value of Social Security benefits and on several occasions has intervened to protect them.11
This spotlight describes the circumstances and experiences of student loan borrowers affected by the forced collection of their Social Security benefits.12 It also describes how the purpose of Social Security is being increasingly undermined by the limited and deficient options the Department of Education has to protect Social Security beneficiaries from poverty and hardship.
The forced collection of Social Security benefits has increased exponentially.
Federal student loans enter default after 270 days of missed payments and transfer to the Department of Education’s default collections program after 360 days. Borrowers with a loan in default face several consequences: (1) their credit is negatively affected; (2) they lose eligibility to receive federal student aid while their loans are in default; (3) they are unable to change repayment plans and request deferment and forbearance;13 and (4) they face forced collections of tax refunds, Social Security benefits, and wages among other payments.14 To conduct its forced collections of federal payments like tax refunds and Social Security benefits, the Department of Education relies on a collection service run by the U.S. Department of the Treasury called the Treasury Offset Program.15
Between 2001 and 2019, the number of student loan borrowers facing forced collection of their Social Security benefits increased from at least 6,200 to 192,300.16 That is a more than 3,000 percent increase in fewer than 20 years. By comparison, the number of borrowers facing forced collections of their tax refunds increased by about 90 percent from 1.17 million to 2.22 million during the same period.17
This exponential growth of Social Security offsets between 2001 and 2019 is likely driven by multiple factors including:
- Older borrowers accounted for an increasingly large share of the federal student loan portfolio due to increasing average age of enrollment and length of time in repayment. Data from the Department of Education (which is only available since 2017), show that the number of student loan borrowers ages 62 and older, increased 24 percent from 1.7 million in 2017 to 2.1 million in 2019, compared to less than 1 percent among borrowers under the age of 62.18
- A larger number of borrowers, especially older borrowers, had loans in default. Data from the Department of Education show that the number of student loan borrowers with a defaulted loan increased by 230 percent from 3.8 million in 2006 to 8.8 million in 2019.19 Compounding these trends is the fact that older borrowers are twice as likely to have a loan in default than younger borrowers.20
Due to these factors, the total amount of Social Security benefits the Department of Education collected between 2001 and 2019 through the offset program increased annually from $16.2 million to $429.7 million (when adjusted for inflation).21 This increase occurred even though the average monthly amount the Department of Education collected from individual beneficiaries was the same for most years, at approximately $180 per month.22
Figure 1: Number of Social Security beneficiaries and total amount collected for student loans (2001-2019)
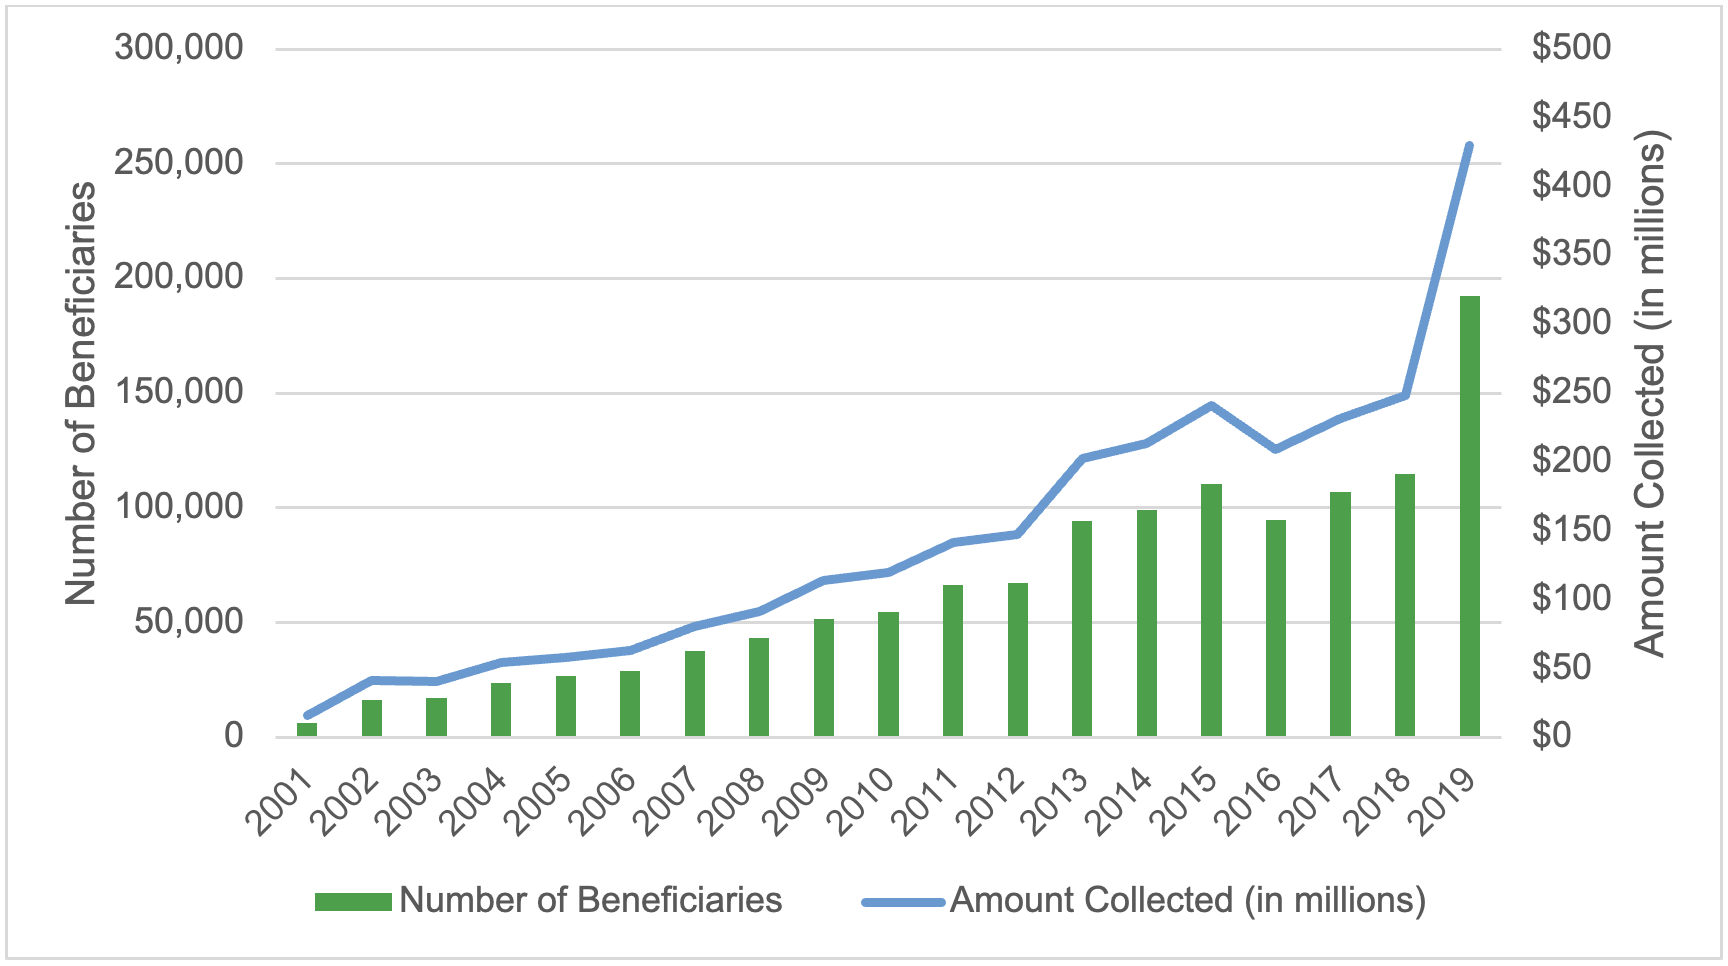
Source: CFPB analysis of public data from U.S. Treasury’s Fiscal Data portal. Amounts are presented in 2024 dollars.
While the total collected from Social Security benefits has increased exponentially, the majority of money the Department of Education collected has not been applied to borrowers’ principal amount owed. Specifically, nearly three-quarters of the monies the Department of Education collects through offsets is applied to interest and fees, and not towards paying down principal balances.23 Between 2016 and 2019, the U.S. Department of the Treasury charged the Department of Education between $13.12 and $15.00 per Social Security offset, or approximately between $157.44 and $180 for 12 months of Social Security offsets per beneficiary with defaulted federal student loans.24 As a matter of practice, the Department of Education often passes these fees on directly to borrowers.25 Furthermore, these fees accounted for nearly 10 percent of the average monthly borrower’s lost Social Security benefits which was $183 during this time.26 Interest and fees not only reduce beneficiaries’ monthly benefits, but also prolong the period that beneficiaries are likely subject to forced collections.
Forced collections are compromising Social Security beneficiaries’ financial well-being.
Forced collection of Social Security benefits affects the financial well-being of the most vulnerable borrowers and can exacerbate any financial and health challenges they may already be experiencing. The CFPB’s analysis of the Survey of Income and Program Participation (SIPP) pooled data for 2018 to 2021 finds that Social Security beneficiaries with student loans receive an average monthly benefit of $1,524.27 The analysis also indicates that approximately 480,000 (37 percent) of the 1.3 million beneficiaries with student loans rely on these modest payments for 90 percent or more of their income,28 thereby making them particularly vulnerable to reduction in their benefits especially if benefits are offset year-round. In 2019, the average annual amount collected from individual beneficiaries was $2,232 ($186 per month).29
A recent survey from The Pew Charitable Trusts found that more than nine in ten borrowers who reported experiencing wage garnishment or Social Security payment offsets said that these penalties caused them financial hardship.30 Consequently, for many, their ability to meet their basic needs, including access to healthcare, became more difficult. According to our analysis of the Federal Reserve’s Survey of Household Economic and Decision-making (SHED), half of Social Security beneficiaries with defaulted student loans skipped a doctor’s visit and/or did not obtain prescription medication due to cost.31 Moreover, 36 percent of Social Security beneficiaries with loans in delinquency or in collections report fair or poor health. Over half of them have medical debt.32
Figure 2: Selected financial experiences and hardships among subgroups of loan borrowers
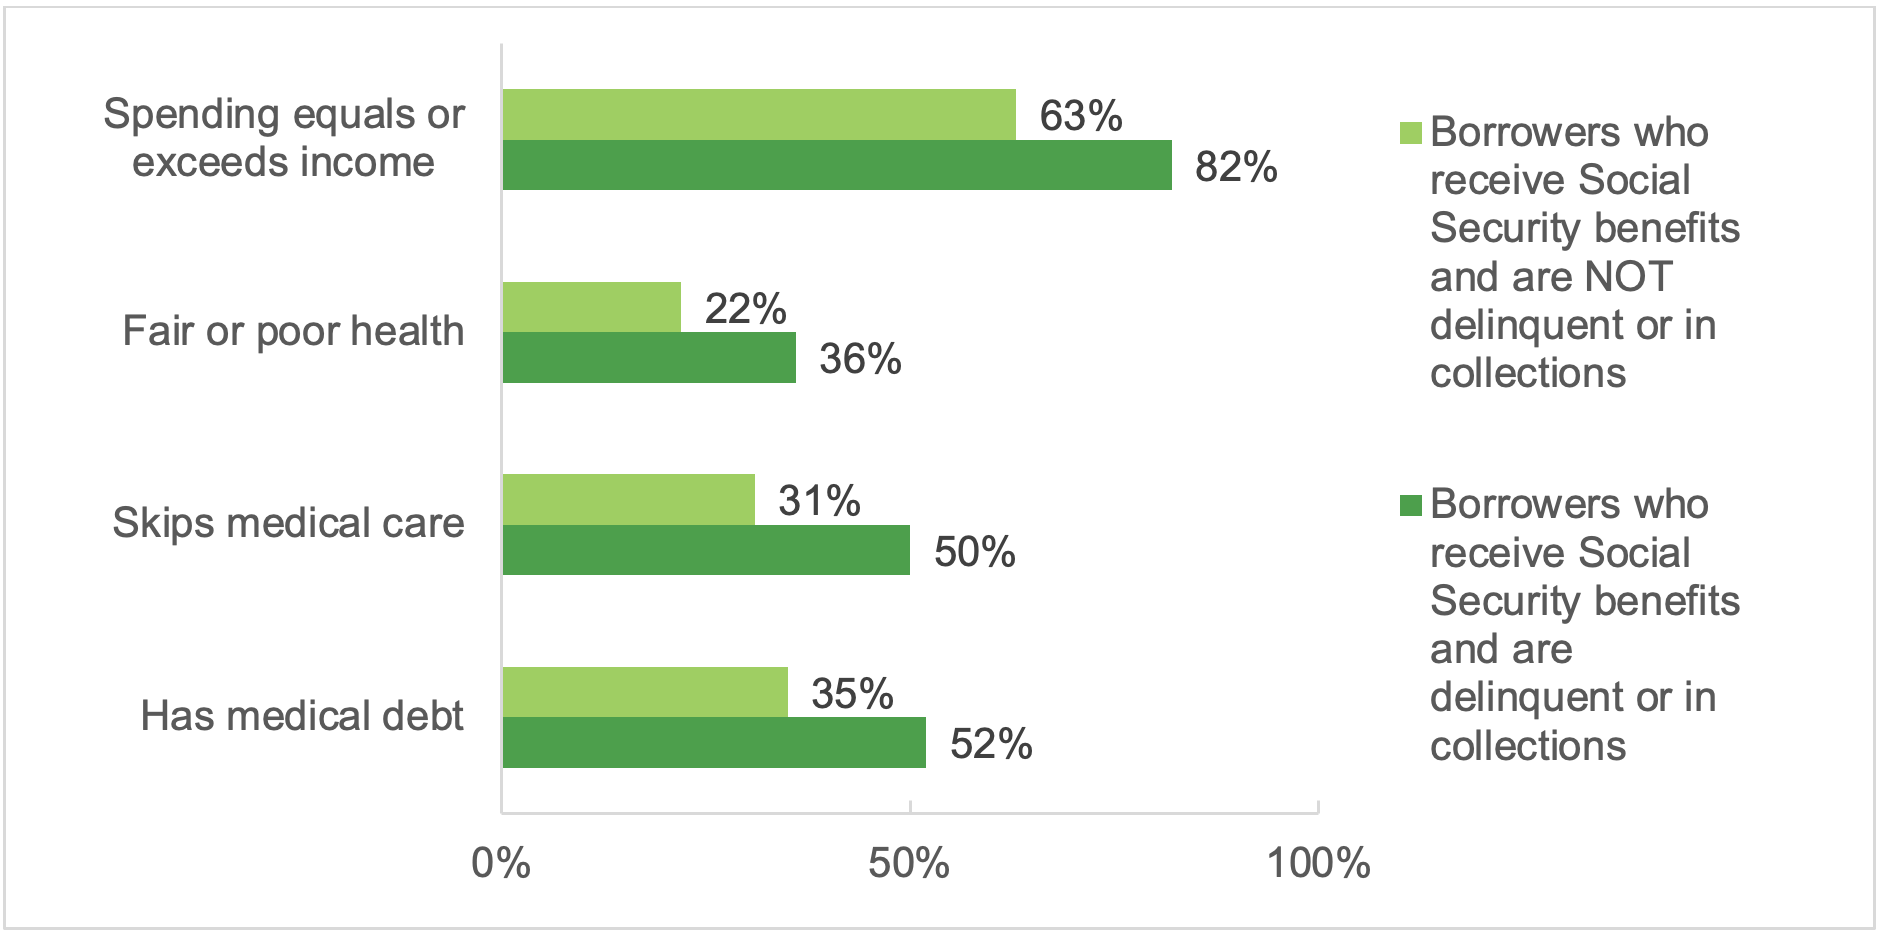
Source: CFPB analysis of the Federal Reserve Board Survey of Household Economic and Decision-making (2019-2023).
Social Security recipients subject to forced collection may not be able to access key public benefits that could help them mitigate the loss of income. This is because Social Security beneficiaries must list the unreduced amount of their benefits prior to collections when applying for other means-tested benefits programs such as Social Security Insurance (SSI), Supplemental Nutrition Assistance Program (SNAP), and the Medicare Savings Programs.33 Consequently, beneficiaries subject to forced collections must report an inflated income relative to what they are actually receiving. As a result, these beneficiaries may be denied public benefits that provide food, medical care, prescription drugs, and assistance with paying for other daily living costs.34
Consumers’ complaints submitted to the CFPB describe the hardship caused by forced collections on borrowers reliant on Social Security benefits to pay for essential expenses.35 Consumers often explain their difficulty paying for such expenses as rent and medical bills. In one complaint, a consumer noted that they were having difficulty paying their rent since their Social Security benefit usually went to paying that expense.36 In another complaint, a caregiver described that the money was being withheld from their mother’s Social Security, which was the only source of income used to pay for their mother’s care at an assisted living facility.37 As forced collections threaten the housing security and health of Social Security beneficiaries, they also create a financial burden on non-borrowers who help address these hardships, including family members and caregivers.
Existing minimum income protections fail to protect student loan borrowers with Social Security against financial hardship.
The Debt Collection Improvement Act set a minimum floor of income below which the federal government cannot offset Social Security benefits and subsequent Treasury regulations established a cap on the percentage of income above that floor.38 Specifically, these statutory guardrails limit collections to 15 percent of Social Security benefits above $750. The minimum threshold was established in 1996 and has not been updated since. As a result, the amount protected by law alone does not adequately protect beneficiaries from financial hardship and in fact no longer protects them from falling below the federal poverty level (FPL). In 1996, $750 was nearly $100 above the monthly poverty threshold for an individual.39 Today that same protection is $400 below the threshold. If the protected amount of $750 per month ($9,000 per year) set in 1996 was adjusted for inflation, in 2024 dollars, it would total $1,450 per month ($17,400 per year).40
Figure 3: Comparison of monthly FPL threshold with the current protected amount established in 1996 and the amount that would be protected with inflation adjustment
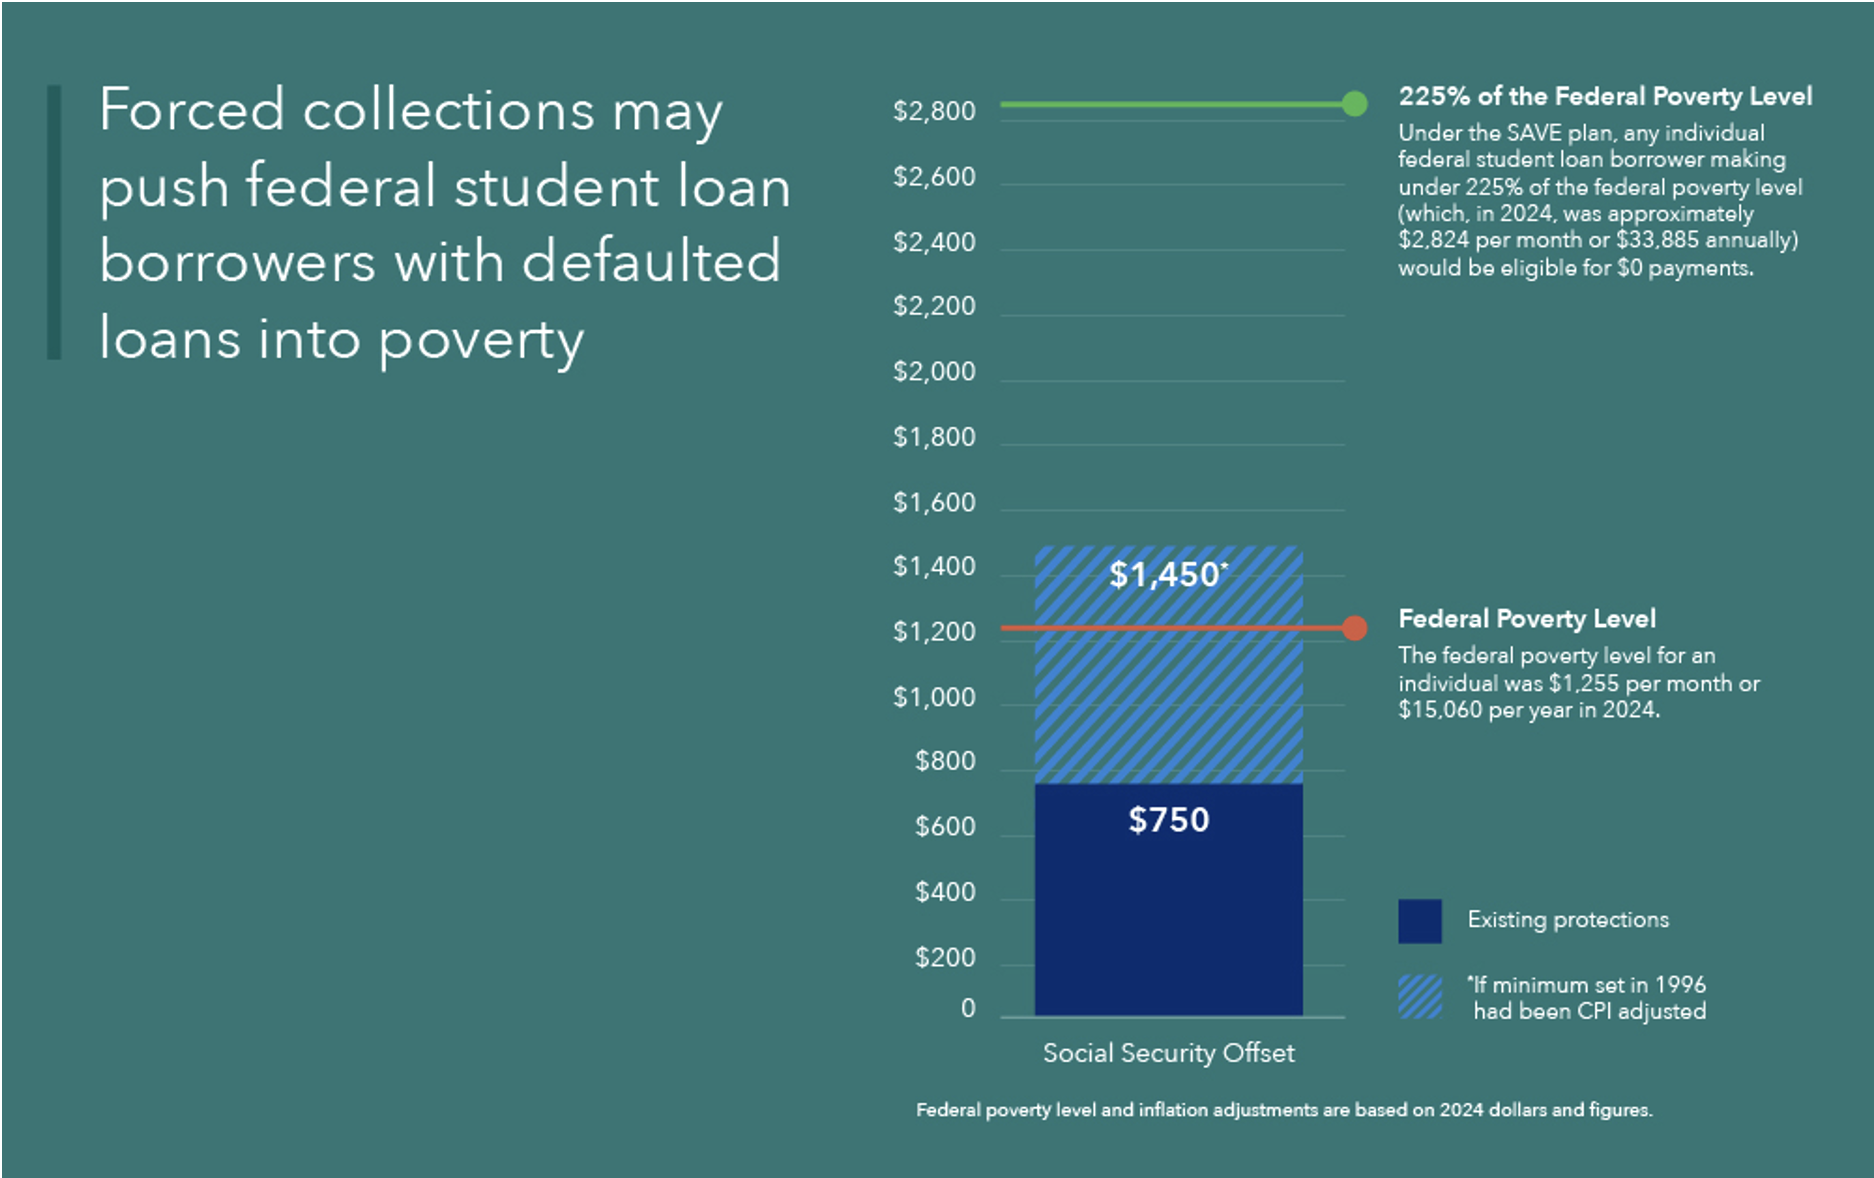
Source: Calculations by the CFPB. Notes: Inflation adjustments based on the consumer price index (CPI).
Even if the minimum protected income of $750 is adjusted for inflation, beneficiaries will likely still experience hardship as a result of their reduced benefits. Consumers with incomes above the poverty line also commonly experience material hardship.41 This suggests that a threshold that is higher than the poverty level will more effectively protect against hardship.42 Indeed, in determining an income threshold for $0 payments under the SAVE plan, the Department of Education researchers used material hardship (defined as being unable to pay utility bills and reporting food insecurity) as their primary metric, and found similar levels of material hardship among those with incomes below the poverty line and those with incomes up to 225 percent of the FPL.43 Similarly, the CFPB’s analysis of a pooled sample of SIPP respondents finds the same levels of material hardship for Social Security beneficiaries with student loans with incomes below 100 percent of the FPL and those with incomes up to 225 percent of the FPL.44 The CFPB found that for 87 percent of student loan borrowers who receive Social Security, their benefit amount is below 225 percent of the FPL.45 Accordingly, all of those borrowers would be removed from forced collections if the Department of Education applied the same income metrics it established under the SAVE program to an automatic hardship exemption program.
Existing options for relief from forced collections fail to reach older borrowers.
Borrowers with loans in default remain eligible for certain types of loan cancellation and relief from forced collections. However, our analysis suggests that these programs may not be reaching many eligible consumers. When borrowers do not benefit from these programs, their hardship includes, but is not limited to, unnecessary losses to their Social Security benefits and negative credit reporting.
Borrowers who become disabled after reaching full retirement age may miss out on Total and Permanent Disability
The Total and Permanent Disability (TPD) discharge program cancels federal student loans and effectively stops all forced collections for disabled borrowers who meet certain requirements. After recent revisions to the program, this form of cancelation has become common for those borrowers with Social Security who became disabled prior to full retirement age.46 In 2016, a GAO study documented the significant barriers to TPD that Social Security beneficiaries faced.47 To address GAO’s concerns, the Department of Education in 2021 took a series of mitigating actions, including entering into a data-matching agreement with the Social Security Administration (SSA) to automate the TPD eligibility determination and discharge process.48 This process was expanded further with new final rules being implemented July 1, 2023 that expanded the categories of borrowers eligible for automatic TPD cancellation.49 In total, these changes successfully resulted in loan cancelations for approximately 570,000 borrowers.50
However, the automation and other regulatory changes did not significantly change the application process for consumers who become disabled after they reach full retirement age or who have already claimed the Social Security retirement benefits. For these beneficiaries, because they are already receiving retirement benefits, SSA does not need to determine disability status. Likewise, SSA does not track disability status for those individuals who become disabled after they start collecting their Social Security retirement benefits.51
Consequently, SSA does not transfer information on disability to the Department of Education once the beneficiary begins collecting Social Security retirement.52 These individuals therefore will not automatically get a TPD discharge of their student loans, and they must be aware and physically and mentally able to proactively apply for the discharge.53
The CFPB’s analysis of the Census survey data suggests that the population that is excluded from the TPD automation process could be substantial. More than one in five (22 percent) Social Security beneficiaries with student loans are receiving retirement benefits and report a disability such as a limitation with vision, hearing, mobility, or cognition.54 People with dementia and other cognitive disabilities are among those with the greatest risk of being excluded, since they are more likely to be diagnosed after the age 70, which is the maximum age for claiming retirement benefits.55
These limitations may also help explain why older borrowers are less likely to rehabilitate their defaulted student loans. Specifically, 11 percent of student loan borrowers ages 50 to 59 facing forced collections successfully rehabilitated their loans,56 while only five percent of borrowers over the age of 75 do so.57
Figure 4: Number of student loan borrowers ages 50 and older in forced collection, borrowers who signed a rehabilitation agreement, and borrowers who successfully rehabilitated a loan by selected age groups
| Age Group | Number of Borrowers in Offset | Number of Borrowers Who Signed a Rehabilitation Agreement | Percent of Borrowers Who Signed a Rehabilitation Agreement | Number of Borrowers Successfully Rehabilitated | Percent of Borrowers who Successfully Rehabilitated |
|---|---|---|---|---|---|
| 50 to 59 | 265,200 | 50,800 | 14% | 38,400 | 11% |
| 60 to 74 | 184,900 | 24,100 | 11% | 18,500 | 8% |
| 75 and older | 15,800 | 1,000 | 6% | 800 | 5% |
Source: CFPB analysis of data provided by the Department of Education.
Shifting demographics of student loan borrowers suggest that the current automation process may become less effective to protect Social Security benefits from forced collections as more and more older adults have student loan debt. The fastest growing segment of student loan borrowers are adults ages 62 and older. These individuals are generally eligible for retirement benefits, not disability benefits, because they cannot receive both classifications at the same time. Data from the Department of Education reflect that the number of student loan borrowers ages 62 and older increased by 59 percent from 1.7 million in 2017 to 2.7 million in 2023. In comparison, the number of borrowers under the age of 62 remained unchanged at 43 million in both years.58 Furthermore, additional data provided to the CFPB by the Department of Education show that nearly 90,000 borrowers ages 81 and older hold an average amount of $29,000 in federal student loan debt, a substantial amount despite facing an estimated average life expectancy of less than nine years.59
Existing exceptions to forced collections fail to protect many Social Security beneficiaries
In addition to TPD discharge, the Department of Education offers reduction or suspension of Social Security offset where borrowers demonstrate financial hardship.60 To show hardship, borrowers must provide documentation of their income and expenses, which the Department of Education then uses to make its determination.61 Unlike the Debt Collection Improvement Act’s minimum protections, the eligibility for hardship is based on a comparison of an individual’s documented income and qualified expenses. If the borrower has eligible monthly expenses that exceed or match their income, the Department of Education then grants a financial hardship exemption.62
The CFPB’s analysis suggests that the vast majority of Social Security beneficiaries with student loans would qualify for a hardship protection. According to CFPB’s analysis of the Federal Reserve Board’s SHED, eight in ten (82 percent) of Social Security beneficiaries with student loans in default report that their expenses equal or exceed their income.63 Accordingly, these individuals would likely qualify for a full suspension of forced collections. Yet the GAO found that in 2015 (when the last data was available) less than ten percent of Social Security beneficiaries with forced collections applied for a hardship exemption or reduction of their offset.64 A possible reason for the low uptake rate is that many beneficiaries or their caregivers never learn about the hardship exemption or the possibility of a reduction in the offset amount.65 For those that do apply, only a fraction get relief. The GAO study found that at the time of their initial offset, only about 20 percent of Social Security beneficiaries ages 50 and older with forced collections were approved for a financial hardship exemption or a reduction of the offset amount if they applied.66
Conclusion
As hundreds of thousands of student loan borrowers with loans in default face the resumption of forced collection of their Social Security benefits, this spotlight shows that the forced collection of Social Security benefits causes significant hardship among affected borrowers. The spotlight also shows that the basic income protections aimed at preventing poverty and hardship among affected borrowers have become increasingly ineffective over time. While the Department of Education has made some improvements to expand access to relief options, especially for those who initially receive Social Security due to a disability, these improvements are insufficient to protect older adults from the forced collection of their Social Security benefits.
Taken together, these findings suggest that forced collections of Social Security benefits increasingly interfere with Social Security’s longstanding purpose of protecting its beneficiaries from poverty and financial instability. These findings also suggest that alternative approaches are needed to address the harm that forced collections cause on beneficiaries and to compensate for the declining effectiveness of existing remedies. One potential solution may be found in the Debt Collection Improvement Act, which provides that when forced collections “interfere substantially with or defeat the purposes of the payment certifying agency’s program” the head of an agency may request from the Secretary of the Treasury an exemption from forced collections.67 Given the data findings above, such a request for relief from the Commissioner of the Social Security Administration on behalf of Social Security beneficiaries who have defaulted student loans could be justified. Unless the toll of forced collections on Social Security beneficiaries is considered alongside the program’s stated goals, the number of older adults facing these challenges is only set to grow.
Data and Methodology
To develop this report, the CFPB relied primarily upon original analysis of public-use data from the U.S. Census Bureau Survey of Income and Program Participation (SIPP), the Federal Reserve Board Board’s Survey of Household Economics and Decision-making (SHED), U.S. Department of the Treasury, Fiscal Data portal, consumer complaints received by the Bureau, and administrative data on borrowers in default provided by the Department of Education. The report also leverages data and findings from other reports, studies, and sources, and cites to these sources accordingly. Readers should note that estimates drawn from survey data are subject to measurement error resulting, among other things, from reporting biases and question wording.
Survey of Income and Program Participation
The Survey of Income and Program Participation (SIPP) is a nationally representative survey of U.S. households conducted by the U.S. Census Bureau. The SIPP collects data from about 20,000 households (40,000 people) per wave. The survey captures a wide range of characteristics and information about these households and their members. The CFPB relied on a pooled sample of responses from 2018, 2019, 2020, and 2021 waves for a total number of 17,607 responses from student loan borrowers across all waves, including 920 respondents with student loans receiving Social Security benefits. The CFPB’s analysis relied on the public use data. To capture student loan debt, the survey asked to all respondents (variable EOEDDEBT): Owed any money for student loans or educational expenses in own name only during the reference period. To capture receipt of Social Security benefits, the survey asked to all respondents (variable ESSSANY): “Did ... receive Social Security benefits for himself/herself at any time during the reference period?” To capture amount of Social Security benefits, the survey asked to all respondents (variable TSSSAMT): “How much did ... receive in Social Security benefit payment in this month (1-12), prior to any deductions for Medicare premiums?”
The public-use version of the survey dataset, and the survey documentation can be found at: https://www.census.gov/programs-surveys/sipp.html .
Survey of Household Economics and Decision-making
The Federal Reserve Board’s Survey of Household Economics and Decision-making (SHED) is an annual web-based survey of households. The survey captures information about respondents’ financial situations. The CFPB relied on a pooled sample of responses from 2019 through 2023 waves for a total number of 1,376 responses from student loan borrowers in collection across all waves. The CFPB analysis relied on the public use data. To capture default and collection, the survey asked all respondents with student loans (variable SL6): “Are you behind on payments or in collections for one or more of the student loans from your own education?” To capture receipt of Social Security benefits, the survey asked to all respondents (variable I0_c): “In the past 12 months, did you (and/or your spouse or partner) receive any income from the following sources: Social Security (including old age and DI)?”
The public-use version of the survey dataset, and the survey documentation can be found at https://www.federalreserve.gov/consumerscommunities/shed_data.htm .
Appendix A: Number of student loan borrowers ages 60 and older, total outstanding balance, and average balance by age group, August 2024
| Age Group | Borrower Count (in thousands) | Balance (in billions) | Average balance |
|---|---|---|---|
60 to 65 |
1,951.4 |
$87.49 |
$44,834 |
66 to 70 |
909.8 |
$39.47 |
$43,383 |
71 to 75 |
457.5 |
$18.95 |
$41,421 |
76 to 80 |
179.0 |
$6.80 |
$37,989 |
81 to 85 |
59.9 |
$1.90 |
$31,720 |
86 to 90 |
20.1 |
$0.51 |
$25,373 |
91 to 95 |
7.0 |
$0.14 |
$20,000 |
96+ |
2.8 |
$0.05 |
$17,857 |
Source: Data provided by the Department of Education.
Endnotes
-
The CARES Act, passed on March 27, 2020, temporarily reduced interest rates to zero and suspended monthly payments for all federal loans owned by the Department of Education. While the payment suspension through the CARES Act expired on September 30, 2020, it was repeatedly extended administratively through October 2023. In 2021, the Department of Education extended these protections to defaulted commercially held FFEL loans. In addition to the payment “pause,” the CARES Act and other related initiatives temporarily removed many of the negative consequences of federal student loan default, such as forced collections and negative credit reporting, for certain borrowers. Congressional Research Service, Student Loans: A Timeline of Actions Taken in Light of the COVID-19 Pandemic, (Updated Jun. 23, 2023), https://crsreports.congress.gov/product/pdf/IF/IF12136 ; U.S. Department of Education, Office of Federal Student Aid, COVID-19 Emergency Relief and Federal Student Aid: History of the COVID-19 Emergency Relief Flexibilities, (accessed Mar. 17, 2023), https://studentaid.gov/announcements-events/covid-19#resources . CARES Act benefits do not extend to private student loans or certain federal student loans not held by the Department of Education; See, e.g., U.S. Department of Education, Office of Federal Student Aid, A Fresh Start for Federal Student Loan Borrowers in Default, (accessed Feb. 16, 2023), https://studentaid.gov/announcements-events/default-fresh-start
↩ -
Consumer Financial Protection Bureau (CFPB), Annual Report of the CFPB Student Loan Ombudsman (Nov. 2024), https://files.consumerfinance.gov/f/documents/cfpb_2024-annual-student-loan-ombudsmans-report_2024-11.pdf
↩ -
This number was obtained by applying the percentage of student loan borrowers ages 62 and older receiving Social Security benefits (59 percent), based on the Census Bureau’s Survey of Income and Program Participation, to the total number of older borrowers in default in January 2023 (761,200), as provided by the Department of Education.
↩ -
The Spotlight highlights the experiences of borrowers of all ages who are Social Security beneficiaries, but when an experience or data point is specific to older adults 62 years and older, the Spotlight will clearly delineate. Age 62 is the earliest age for claiming Social Security retirement benefits.
↩ -
Social Security was created in response to the widespread poverty experienced by older adults during the Great Depression, and the inadequate safety net provided by state welfare programs at that time. Social Security was designed as a social insurance program, paid by contributions from employees and employers, to provide a basic level of income that would protect its insured workers and their families. At the same time, the program was intended to reduce their dependence on welfare. See, e.g. GAO, Social Security’s Future: Answers to key questions, https://www.gao.gov/assets/gao-16-75sp.pdf ; Social Security Administration, Historical Background and Development of Social Security, https://www.ssa.gov/history/briefhistory3.html (Accessed Nov. 8, 2024).
↩ -
Consumer Financial Protection Bureau (CFPB), Annual Report of the CFPB Student Loan Ombudsman (Nov. 2024), https://files.consumerfinance.gov/f/documents/cfpb_2024-annual-student-loan-ombudsmans-report_2024-11.pdf .
↩ -
This number was obtained by applying the percentage of student loan borrowers ages 62 and older receiving Social Security benefits (59 percent), based on the Census Bureau’s Survey of Income and Program Participation, to the total number of older borrowers in default in January 2023 (761,200), as provided by the Department of Education.
↩ -
Social Security was created in response to the widespread poverty experienced by older adults during the Great Depression, and the inadequate safety net provided by state welfare programs at that time. Social Security was designed as a social insurance program, paid by contributions from employees and employers, to provide a basic level of income that would protect its insured workers and their families. At the same time, the program was intended to reduce their dependence on welfare. See, e.g. GAO, Social Security’s Future: Answers to key questions, https://www.gao.gov/assets/gao-16-75sp.pdf ; Social Security Administration, Historical Background and Development of Social Security, https://www.ssa.gov/history/briefhistory3.html (Accessed Nov. 8, 2024).
↩ -
Social Security Administration, Mission and structure, https://www.ssa.gov/agency (Accessed August 6, 2024).
↩ -
Based on the latest estimates using the Supplemental Poverty Measure which enhances the official poverty measure by accounting, among other things, for geographic variation in poverty thresholds and the effects of government programs and transfers. Shrider, Emily and John Creamer, U.S. Census Bureau, Poverty in the United States: 2022, (September 2023), https://www.census.gov/library/publications/2023/demo/p60-280.html (Accessed Sept. 24, 2024).
↩ -
For example, Congress required the Social Security program to annually apply a Cost of Living Adjustment to protect against the devaluation of its benefits from inflation. Likewise, accounting for the fact that many older adults use their income from Social Security to pay their Medicare premiums, Congress protected said benefits from being lowered in years when the monthly Medicare premium for Part B was higher than the average increase in monthly benefits. See, Social Security Administration, Cost-Of-Living Adjustments, https://www.ssa.gov/oact/cola/colaseries.html (Accessed Nov. 8, 2024); and Social Security Administration, How the Hold Harmless Provision Protects Your Benefits, https://blog.ssa.gov/how-the-hold-harmless-provision-protects-your-benefits (Accessed Nov. 8, 2024).
↩ -
The Spotlight highlights the experiences of borrowers of all ages, but when an experience or data point is specific to older adults 62 years and older, the Spotlight will clearly delineate.
↩ -
Defaulted loans are not eligible for repayment under the SAVE, PAYE, or ICR Plans. However, starting in September 2024, defaulted Direct Loans are eligible for the IBR Plan. The Income-Based Repayment Plan is a repayment plan with monthly payments that are generally between 10 percent or 15 percent of the borrower’s discretionary income divided by 12. For more information about the IBR Plan, see U.S. Department of Education, What is the Income-Based Repayment (IBR) Plan?, https://studentaid.gov/help-center/answers/article/ibr-plan (Accessed on July 10, 2024).
↩ -
U.S. Department of Education, Student Loan Delinquency and Default, https://studentaid.gov/manage-loans/default (Accessed on June 18, 2024).
↩ -
U.S. Department of the Treasury, Bureau of Fiscal Service, Treasury Offset Program, https://www.fiscal.treasury.gov/top/ (Accessed Nov. 8, 2024).
↩ -
The U.S. Department of the Treasury publishes the gross and net amount collected though offset and the number of transactions. The data, however, do not show the number of individuals in collection. The number of individuals is obtained by dividing the number of transactions by twelve (months), so it undercounts the number of borrowers to the extent that they enter and exit the Social Security or offset programs throughout the year for any reason. For the purposes of this analysis, the CFPB relied on the net amount collected and the net number of transactions where the creditor was the Department of Education and the payment source was Social Security Administration. The net amount and count of offsets represent the values once reversals have been removed. The data and information are available at https://fiscaldata.treasury.gov/datasets/treasury-offset-program/federal-collections (Accessed April 8, 2024). Research has established that a majority of borrowers who face Social Security offsets experience offsets for over a year. See e.g., U.S. Government Accountability Office, Social Security Offsets: Improvements to Program Design Could Better Assist Older Student Loan Borrowers with Obtaining Permitted Relief (Dec. 2016), at 20-22 http://www.gao.gov/assets/690/681722.pdf (Establishing that 58 percent of older borrowers who were subject to offset between 2001 and 2010 remained subject to offset for one year or more); See also, e.g., Pew Charitable Trusts, Survey on Student Loan Borrowers 2021 Toplines, (2021), https://www.pewtrusts.org/-/media/assets/2022/06/survey-on-student-loan-borrowers-2021-topline.pdf at 74 (Establishing that roughly 75 percent of survey respondents who experienced Social Security offset did so for one year or more in a representative sample fielded in June and July 2021).
↩ -
U.S. Department of the Treasury, Fiscal Data: Treasury Offset Program, https://fiscaldata.treasury.gov/datasets/treasury-offset-program/federal-collections (Accessed April 8, 2024).
↩ -
U.S. Department of Education, Federal Student Loan Portfolio by Borrower Age, https://studentaid.gov/sites/default/files/fsawg/datacenter/library/Portfolio-by-Age.xls (Accessed Nov. 8, 2024).
↩ -
CFPB analysis of data provided by the Department of Education.
↩ -
CFPB analysis of data provided by the Department of Education for January 2023 finds that 28 percent of federal student loan borrowers ages 62 and older were in default compared to 14 percent of borrowers under the age of 62. See also, GAO, Older Americans: Inability to Repay Student Loans May Affect Financial Security of a Small Percentage of Retirees, (Sept. 2024), https://www.gao.gov/products/gao-14-866t . Finding that “[a]lthough older borrowers hold a small portion of federal student loans, they hold defaulted loans at a higher rate than younger borrowers. Individuals 65 or older held 1 percent of outstanding federal student loans in fiscal year 2013. However, 12 percent of federal student loans held by individuals age 25 to 49 were in default, while 27 percent of loans held by individuals 65 to 74 were in default, and more than half of loans held by individuals 75 or older were in default.”
↩ -
Amounts are presented in 2024 dollars. The nominal amount was $9.1 million in 2001 and $349.5 million in 2019. CFPB staff adjusted the annual amount based on the annual rate of inflation of the consumer price index (CPI) for all urban consumers (CPI-U) using the Minneapolis Fed tables https://www.minneapolisfed.org/about-us/monetary-policy/inflation-calculator/consumer-price-index-1913- (Accessed Nov. 8, 2024).
↩ -
The average amount of benefits offset per transaction fluctuated between $175 in 2008 and $218 in 2001. With the exception of years 2001 through 2003, the average amount per transaction ranged between $175 and $190 per transaction. Amounts are presented in 2024 dollars. CFPB staff adjusted the annual amount based on the annual rate of inflation of the consumer price index (CPI) for all urban consumers (CPI-U) using the Minneapolis Fed tables https://www.minneapolisfed.org/about-us/monetary-policy/inflation-calculator/consumer-price-index-1913- (Accessed Nov. 8, 2024).
↩ -
GAO, Social Security Offsets: Improvements to Program Design Could Better Assist Older Student Loan Borrowers with Obtaining Permitted Relief (Dec. 2016), at 17-19, https://www.gao.gov/assets/gao-16-75sp.pdf . (The GAO found that "Of the approximately $1.1 billion collected through Social Security offsets from fiscal years 2001 through 2015 from borrowers of all ages, about 71 percent was applied to fees and interest - 12 percent to fees and 59 percent to interest - compared to 28 percent that was applied to principal.").
↩ -
The Treasury’s Bureau of the Fiscal Service charges collections fees through the Treasury Offset Program. The fees are set annually and collected from amounts offset. The creditor agency should add this fee to the debt as an administrative cost to the extent allowed by law. Figures for the range of fees charged from 2016 through 2019 were provided by the Treasury’s Bureau of the Fiscal Service.
↩ -
It is the agency's discretion whether or not to pass the charge along to the debtor.
↩ -
Calculations by CFPB staff based on Bureau of the Fiscal Service data available at https://fiscaldata.treasury.gov/datasets/treasury-offset-program/federal-collections (Accessed April 8, 2024). CFPB staff adjusted the amounts based on the annual rate of inflation of the consumer price index (CPI) for all urban consumers (CPI-U) using the Minneapolis Fed tables https://www.minneapolisfed.org/about-us/monetary-policy/inflation-calculator/consumer-price-index-1913- (Accessed Nov. 8, 2024).
↩ -
CFPB analysis of pooled data for 2018 to 2021 from the Census Bureau, Survey of Income and Program Participation (SIPP). Our estimates align with SSA’s administrative data, in December 2021, the average Social Security benefit was $1,530. Social Security Administration, Monthly Statistical Snapshot, Table 2. Social Security benefits, December 2021, https://www.ssa.gov/policy/docs/quickfacts/stat_snapshot/2021-12.html#table2 (Accessed Nov. 8, 2024).
↩ -
CFPB analysis of pooled data from years 2018 to 2021 from the Census Bureau, Survey of Income and Program Participation. To obtain the share CFPB staff divided the total Social Security income (TSSSAMT) by the total personal income (TPTOTINC). Note, however, that multiple studies have found differences in the estimates of the relative importance of Social Security benefits between survey data and survey data supplemented with administrative data. See, e.g. Dushi, Irena and Brad Trenkamp, Improving the Measurement of Retirement Income of the Aged Population, ORES Working Paper No. 116 (Jan 2021), https://www.ssa.gov/policy/docs/workingpapers/wp116.html (Accessed Nov. 8, 2024). The ORES Working Paper also shows that when survey data on income is combined with administrative data from IRS and SSA, 39.9 percent of Social Security beneficiaries rely on Social Security for 50 or more of their income. The SIPP does not ask participants about collections or default in their student loans. However, the CFPB analysis of the pooled data from the Federal Reserve Board’s SHED, which does not include specific amount from Social Security benefits, suggests that a large share of beneficiaries affected by collections have low incomes. Our analysis finds that 44 percent of Social Security beneficiaries who are delinquent or in collections on their student loan have incomes below $25,000.
↩ -
GAO found that 58 percent of older borrowers who were subject to offset between 2001 and 2010 remained subject to offset for one year or more. GAO, Social Security Offsets: Improvements to Program Design Could Better Assist Older Student Loan Borrowers with Obtaining Permitted Relief (Dec. 2016), at 20, http://www.gao.gov/assets/690/681722.pdf . Amounts are presented in 2024 dollars. CFPB staff adjusted the annual amount based in the annual rate of inflation of the consumer price index (CPI) for all urban consumers (CPI-U) using the Minneapolis Fed tables https://www.minneapolisfed.org/about-us/monetary-policy/inflation-calculator/consumer-price-index-1913- (Accessed Nov. 8, 2024).
↩ -
The Pew Charitable Trusts, At What Cost? The Impact of Student Loan Default on Borrowers, https://www.pewtrusts.org/en/research-and-analysis/issue-briefs/2023/02/at-what-cost-the-impact-of-student-loan-default-on-borrowers (Accessed Nov. 8, 2024).
↩ -
CFPB analysis of the Federal Reserve Board Survey of Household Economic and Decision-making. See Appendix A: Methodology for more information about the survey and the analysis.
↩ -
CFPB analysis of the Federal Reserve Board Survey of Household Economic and Decision-making. See Appendix A: Methodology for more information about the survey and the analysis.
↩ -
See e.g. Social Security Act §1902 (r)(2); 42 CFR § 435.601(b) (Rev 1994).
↩ -
These programs include SNAP, Medicaid, and the Medicare Savings Programs (MSP). The MSP programs help many Social Security beneficiaries, who also have Medicare, cover their Medicare related costs.
↩ -
Consumer complaints are submissions that express dissatisfaction with or communicate suspicion of wrongful conduct by an identifiable entity related to a consumer’s personal experience with a financial product or service. The CFPB does not verify the facts alleged in these complaints but takes steps to confirm a commercial relationship between the consumer and the company. More information about the complaint process can be found at: https://www.consumerfinance.gov/complaint/process/.
↩ -
CFPB, Consumer Complaints Database, Complaint 3222633, https://www.consumerfinance.gov/data-research/consumer-complaints/search/detail/3222633
↩ -
CFPB, Consumer Complaints Database, Complaint 3539713, https://www.consumerfinance.gov/data-research/consumer-complaints/search/detail/3539713
↩ -
31 U.S.C. §3716
↩ -
31 U.S.C. §3716(c)
↩ -
U.S. Department of Health and Human Services, Assistant Secretary for Planning and Evaluation (ASPE), Poverty Guidelines, https://aspe.hhs.gov/topics/poverty-economic-mobility/poverty-guidelines (Accessed Nov. 8, 2024).
↩ -
See, e.g., Thomas, M C. “Longitudinal Patterns of Material Hardship among US Families.” Social Indicators Research vol. 163,1 (2022): 341-370. doi:10.1007/s11205-022-02896-8; Ouellette, Tammy et. al, Measures of Material Hardship: Final Report, https://aspe.hhs.gov/reports/measures-material-hardship-final-report (Accessed on June 18, 2024).
↩ -
In recognition of this limitation, multiple alternative measures of income adequacy have been developed over the years, including the Elder Economic Security Standard Index (Elder Index). The Elder Index is “a measure of the income that older adults need to meet their basic needs and age in place with dignity” and it is adjusted for household size, housing tenure, location, and health status. More information about the Elder Index is available at https://elderindex.org/ . One notable finding by researchers who have used this index is that even the average Social Security benefit is below the threshold of what is needed to cover the needs of older Americans. See e.g., Mutchler, Jan and Li, Yang, "The Gap Remains: Social Security Benefits Continue to Fall Short of Covering Basic Cost of Living for Older Americans, 2015-2020" (2020). Center for Social and Demographic Research on Aging Publications.
↩ -
U.S. Department of Education, Improving Income-Driven Repayment for the William D. Ford Federal Direct Loan Program, https://www.regulations.gov/document/ED-2023-OPE-0004-0001 (Accessed on Nov. 8, 2024).
↩ -
CFPB analysis of pooled data from 2018 to 2021 from the Census Bureau, Survey of Income and Program Participation (SIPP). To examine material hardship, CFPB combined the variables RFOODS which measures household’s food security level and variable EAWBGAS which measures whether the householder was unable to pay a utility bill in the survey month. The analysis showed that 34 percent of Social Security beneficiaries with student loans and incomes at or below 100 percent of the FPL reported these hardships, compared to 32 percent of Social Security beneficiaries with student loans and incomes between 101 and 225 percent of the FPL, and 7 percent of Social Security beneficiaries with student loans and incomes above 225 percent of the FPL. These percentages increase to 41 percent of Social Security beneficiaries with student loans and incomes at or below 100 percent of the FPL and 36 percent of Social Security beneficiaries with student loans and incomes between 101 and 225 percent of the FPL if inability to pay rent or mortgage is added to the measure, yet remains at 7 percent for those with incomes above 225 percent of the FPL.
↩ -
CFPB analysis of pooled data from 2018 to 2021 from the Census Bureau, Survey of Income and Program Participation. Because the analysis relied on a pooled sample from multiple years, Social Security benefits were assessed using the corresponding value of 225 percent of the FPL threshold for each survey year.
↩ -
U.S. Department of Education, Total and Permanent Disability Discharge, https://studentaid.gov/manage-loans/forgiveness-cancellation/disability-discharge (Accessed Nov. 8, 2024); GAO, Social Security Offsets: Improvements to Program Design Could Better Assist Older Student Loan Borrowers with Obtaining Permitted Relief (Dec. 2016), http://www.gao.gov/assets/690/681722.pdf .
↩ -
GAO, Social Security Offsets: Improvements to Program Design Could Better Assist Older Student Loan Borrowers with Obtaining Permitted Relief (Dec. 2016), http://www.gao.gov/assets/690/681722.pdf .
↩ -
The details of the agreement can be found at: https://www2.ed.gov/about/offices/list/om/docs/pirms/ssa-mine-cma.pdf .
↩ -
U.S. Department of Education, Final Regulations: Borrower Defense to Repayment, Pre-dispute Arbitration, Interest Capitalization, Total and Permanent Disability Discharges, Closed School Discharges, Public Service Loan Forgiveness, and False Certification Discharges (Nov. 2022) https://fsapartners.ed.gov/knowledge-center/library/federal-registers/2022-11-01/final-regulations-borrower-defense-repayment-pre-dispute-arbitration-interest-capitalization-total-and-permanent-disability-discharges-closed-school-discharges-public-service-loan-forgiveness-and . (Accessed Nov. 8, 2024).
↩ -
U.S. Department of Education, Biden-Harris Administration Approves Additional $4.5 Billion in Student Debt Relief for 60,000 Public Service Workers, Bringing Total to Over 1 Million Public Servants (Aug. 2021), https://www.ed.gov/about/news/press-release/biden-harris-administration-approves-additional-45-billion-student-debt (Accessed Nov. 8, 2024).
↩ -
The Social Security Administration maintains and collects other data that could be useful in assessing disability status after retirement. For example, data on the designation of representative payee indicates that a beneficiary is incapacitated, unable to manage his/her money, or is under a court-appointed guardianship. Likewise, data from Centers for Medicare & Medicaid Services may help identify beneficiaries with severe disabling conditions based on information regarding long-term care institutionalization, or specific Medicare and/or Medicaid claims patterns. For example, CMS’ Medicare or Medicaid claim data may help identify certain beneficiaries with an onset of a disease and other medical conditions that, by definition, meet Social Security's standards for disability benefits eligibility. These diseases and conditions include certain cancers and adult brain disorders that are included in SSA’s list of Compassionate Allowances to help facilitate the award of disability benefits and may require specific treatment and diagnosis in order for services to be covered by Medicare. The full list of Compassionate Allowances is available at: https://www.ssa.gov/compassionateallowances/conditions.htm .
↩ -
The specific information transferred is outlined in the agreement, at: https://www2.ed.gov/about/offices/list/om/docs/pirms/ssa-mine-cma.pdf .
↩ -
U.S. Department of Education, 3 Ways to Qualify for Total and Permanent Disability (TPD) Discharge, https://studentaid.gov/articles/3-ways-qualify-total-permanent-disability-discharge/ (Accessed Nov. 8, 2024).
↩ -
CFPB analysis of U.S. Census Bureau data from 2021 Survey of Income and Program Participation. See Appendix A: Methodology for more information about the survey and the analysis.
↩ -
Olfson, Mark et al. “Age and Incidence of Dementia Diagnosis.” Journal of General Internal Medicine vol. 36,7 (2021): 2167-2169. doi:10.1007/s11606-020-05895-y
↩ -
Rehabilitation requires borrowers to make a series of consecutive (generally, nine) on-time reduced payments based on their income in order to remove their loan from default. To apply, borrowers are required to agree to rehabilitation (usually verbally on the phone) and submit income documentation, expense information, and an application. Once out of default, the Department of Education will place the rehabilitated loan with a new student loan servicer, and borrowers may apply to enroll in an Income Driven Repayment (IDR) plan. For some older borrowers living on a low, fixed income, an income driven repayment can amount to zero payment or a few dollars per month.
↩ -
CFPB analysis of data provided by the Department of Education. This percentage assumes that categories are mutually exclusive. Therefore, the denominator is the sum of borrowers in offset, (3) borrowers who signed a rehabilitation agreement, and (3) borrowers successfully rehabilitated.
↩ -
U.S. Department of Education, Federal Student Loan Portfolio by Borrower Age, https://studentaid.gov/sites/default/files/fsawg/datacenter/library/Portfolio-by-Age.xls (Accessed Nov. 8, 2024).
↩ -
CFPB analysis of data provided by the Department of Education. In total, borrowers age 81 and older owed $2.6 billion in outstanding loans (an average of $28,950 per borrower) as of August 2024. See Appendix A for detailed data. The average life expectancy at age 81 was obtained from the Social Security Administration, Actuarial Life Table, at https://www.ssa.gov/oact/STATS/table4c6.html (Accessed Nov. 8 2024).
↩ -
U.S. Department of Education, Office of Federal Student Aid, Collections on Defaulted Loans, https://studentaid.gov/manage-loans/default/collections (Accessed Nov. 8 2024). ED’s webpage provides the following guidance to defaulted borrowers who are subject to offsets: “You do have the right to request a review of your account to prevent the offset from occurring. … Contact your loan holder for more information about Treasury offset or the review process (including how to request a review).”
↩ -
Qualified expenses are based on the IRS collection standards which specify allowable expenses for housing, transportation, food, clothing, and certain other expenses.
↩ -
If the borrower shows income above the allowable expenses they may still qualify for a partial financial hardship and reduction in the amount of the forced collections.
↩ -
Consumers self-report that their income is the same as or less than their expenses from (variable: I20). Federal Reserve Board, Survey of Household Economic and Decision-making (pooled sample 2019-2023). See Appendix A: Methodology for more information about the survey and the analysis.
↩ -
According to the GAO’s study, 15,204 of the total 173,000 Social Security beneficiaries of all ages in collections requested an exemption or reduction in their offset amount. See, GAO, Social Security Offsets: Improvements to Program Design Could Better Assist Older Student Loan Borrowers with Obtaining Permitted Relief (Dec. 2016), http://www.gao.gov/assets/690/681722.pdf .
↩ -
In contrast to the TPD process, which recognizes the role of representative payees and other caregivers. For example, the form used to apply for a hardship exemption assumes that the person completing the form is the actual borrower and does not provide a way to certify that the form was completed by a caregiver or fiduciary such as a guardian. See, Request to Stop or Reduce Offset of Social Security Benefits, https://fsapartners.ed.gov/sites/default/files/attachments/2019-09/ReqStopReduceOffsetSocSecBenefits.pdf
↩ -
This figure combines both approvals for both hardship and reduction in offset. GAO, Social Security Offsets: Improvements to Program Design Could Better Assist Older Student Loan Borrowers with Obtaining Permitted Relief (Dec. 2016), http://www.gao.gov/assets/690/681722.pdf .
↩ -
31 CFR 901.3(b)(6)
↩
Page last modified @