Behind on Rent? Examining Rental Housing Delinquencies in New Payment Data
For the 35 percent of American households that live in rental housing, rent is one of their largest expenses.1 Falling behind on rent payments is a potential indicator of economic stress and a possible precursor to more severe outcomes such as having to move or being evicted. In the U.S., there are limited data sources that can describe the degree to which households are falling behind on rent payments.2 We provide a first look at new rental housing payment and delinquency data that may be able to give high-frequency insight into the degree to which consumers are falling behind on their rent.
Using the new rental housing payment data, we find:
- The fraction of renters incurring a late fee in the last twelve months, the most common delinquent status we observe, increased from 15.4 percent at the end of 2021 to 23 percent at the beginning of 2023 but declined to 14 percent by November 2024.
- Around half of renters who incur a late fee return to having their rent paid on time. The remainder continue to persist in some form of delinquent status or are no longer observed in the dataset.
- Among those who incur a late or non-sufficient funds fee, incurring multiple fees of the same type in a twelve-month period is a frequent occurrence.
- The average late fee is around $85, and the average non-sufficient funds fee is around $40. The median outstanding balance ($3,200) and median values of write-offs ($1,850 for non-rent write-offs and $1,650 for rent write-offs).
Data Description
This is the first use of new rental housing payment information that the CFPB purchased to augment its Consumer Credit Information Panel (CCIP). This dataset provides monthly information on renters' rental housing payments, delinquency status, lease information (including contractual rent), and rental housing inquiries sourced from the vendor’s database. While this dataset is not designed to be representative of the U.S. renter population, the data still cover a wide range of renters and geographies and can provide useful statistics on the rental housing market. An accompanying technical report provides more in-depth coverage of what is included in the dataset, provides aggregate statistics, and examines the degree to which the rental housing payment data are representative of the U.S. renter population. The report’s exercises are not intended to evaluate the validity of individual tradelines within the payment data, but to examine the overall trends.
In this spotlight, we document several measures of rent payment delinquency. These include the amount and frequency of two types of fees, non-sufficient funds (NSF) and late fees, that renters incur. An NSF fee indicates that the renter did not have adequate funds in their account when their landlord processed their rent payment. A late fee indicates that the landlord charged the tenant a fee for not having paid their rent on time. We also observe outstanding balances and write-offs. If a renter has failed to pay their full rent amount, an outstanding balance may be reported. A write-off occurs when the landlord has decided to write-off an outstanding balance, which we observe for both rent and non-rent amounts (i.e., utilities and other charges that are not part of the base rent for the property).
What fraction of renters have been behind on their rent in the last twelve months?
For each of these delinquent payment statuses, we examine the fraction of renters with that status over time. Figure 1 shows the percent of renters with a late fee, an NSF fee, an outstanding balance, a non-rent write-off, and a rent write-off in the last twelve months, for each month between September 2021 and November 2024. The statuses are not mutually exclusive and therefore a consumer could have incurred, for example, both a late fee and an NSF fee in the last 12 months. To compute these series, we limited each month's data strictly to renters that had any transaction history within the last twelve months.
Late fees are by far the most common type of delinquency we observe, ranging from 14 percent to 23 percent of active renters, while the remaining statuses are each reported for less than 5 percent of active renters. While there are no direct comparisons to outside sources with the same definition, the proportion of renters behind on their rent is similar to a measure in the Federal Reserve Board's Survey of Household Economics and Decision-making. The 2023 edition of this survey found that 19 percent of renters reported being "behind on their rent at some point in the past year."
The fraction of renters with a late fee in the last twelve months rose after 2021, peaked in 2023, and has since been declining. In September 2021, the fraction of renters with a late fee was just over 15 percent, but this increased to a peak of 23 percent by February of 2023. Since then, the fraction has declined and around 14 percent of renters in November of 2024 had incurred a late fee in the past 12 months.
The fraction of active renters with an outstanding balance has been more stable, hovering at around 5 percent from September 2021 through February 2024. However, since then the rate has decreased to just below 3 percent in November 2024. The fraction with a non-rent write-off and NSF fees have hovered around 3 percent and the fraction of rent write-off is very nearly zero in this sample. This could reflect furnishing behavior and could suggest furnishers rarely use write-offs for rent amounts, rather than providing information about the condition of renters’ accounts.
These combined results could suggest that, overall, the financial conditions of active renters are improving. Additional work in the accompanying technical report suggests that the decrease in the fraction of renters with late fees is not primarily driven by changes in the composition of our rental housing payment data.
Figure 1: Percent of renters with derogatory payment information within the last twelve months3
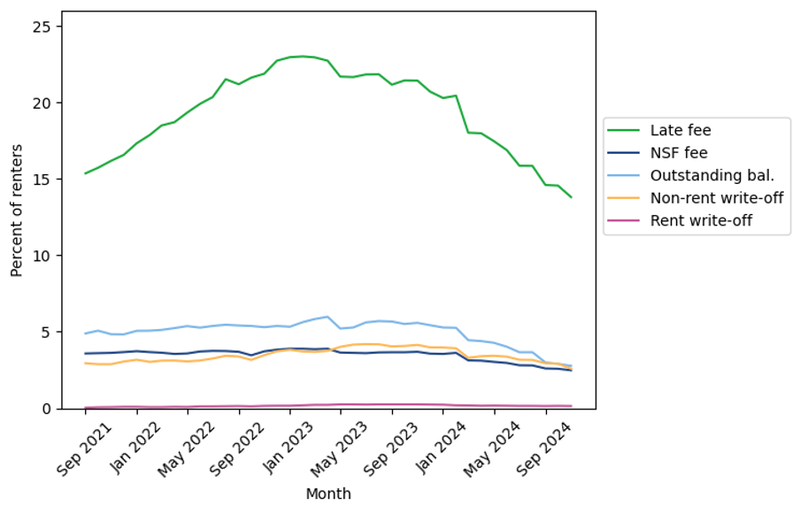
Source: CFPB rental housing payment data
How persistent is rent payment delinquency?
We also examine the degree to which incurring a late fee is a persistent or transient status. To do this, we limit the data to only renters who experience a change in payment status from "paid" to a late fee. In other words, we focus on renters who incur a late fee for the first time within our sample time period and examine what happens in the months following their first late fee. In Figure 2, we show the proportion of these renters across payments statuses up to five months after their first late fee.
We find that over half of renters immediately bounce back to being current. Of those who incur their first late fee, just over half have "paid" as their status in the following months after, meaning that none of the delinquent statuses apply to the renter in that month. The remaining population of late renters seem to persist in some form of delinquency. Around 42 percent of renters incur another late fee in the month immediately following their first late fee, and around 30 percent are still experiencing late fees five months later. The proportion of this population experiencing more serious forms of delinquency, such as outstanding balances and write-offs, also increases in the months following the first late fee. Additionally, we report the proportion of renters who leave our sample and can no longer be observed in each month after their late fee. This likely suggests that the renter has moved and is therefore no longer renting from an entity that reports information to this dataset. While the late fee may impact their decision to move, we cannot necessarily draw any inferences from this figure, as there is a chance that any active renter in our dataset moves and leaves the data.
Figure 2: The status of renters in the months following their first late charge
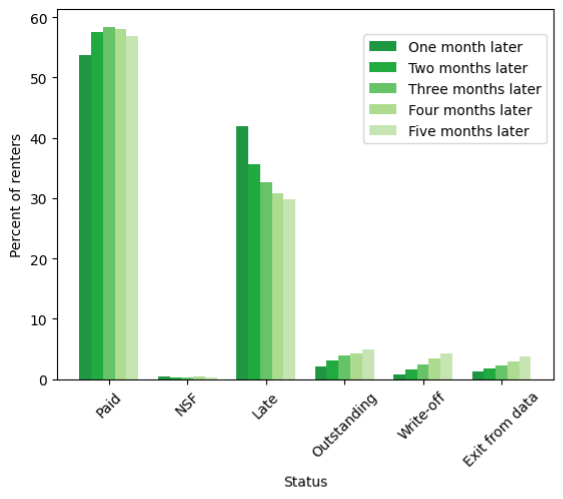
Source: CFPB rental housing payment data
How often do renters incur fees and how much are they?
We examine the frequency of late and NSF fees incurred by renters in this dataset and find that each type of fee is often a repeat occurrence. Figure 3 shows, among renters with at least one late fee in the last 12 months, the proportion of renters who experience a given number of late fees. In other words, an example of a question the figure can answer is: "Of those who incurred a late fee, what fraction had at least 3 or more late fees over 12 months?" We measure this in November 2024 among consumers with active rental histories, though the patterns are very similar when other months are used. Figure 3 also plots the same exercise for NSF fees with the analogous interpretation.
Figure 3 illustrates that if a renter experiences one late fee, there a good chance they experienced another within the 12-month period. Just under 60 percent of those who incur any late fees experience two or more. Over 20 percent of renters with at least one late fee have five or more late fees in the last twelve months. NSF fees are not quite the repeat occurrence that late fees seem to be, but over 20 percent of renters with at least one NSF fee had at least 2 NSF fees.
Figure 3: The percent of renters who have at least X fees, among those with at least one fee
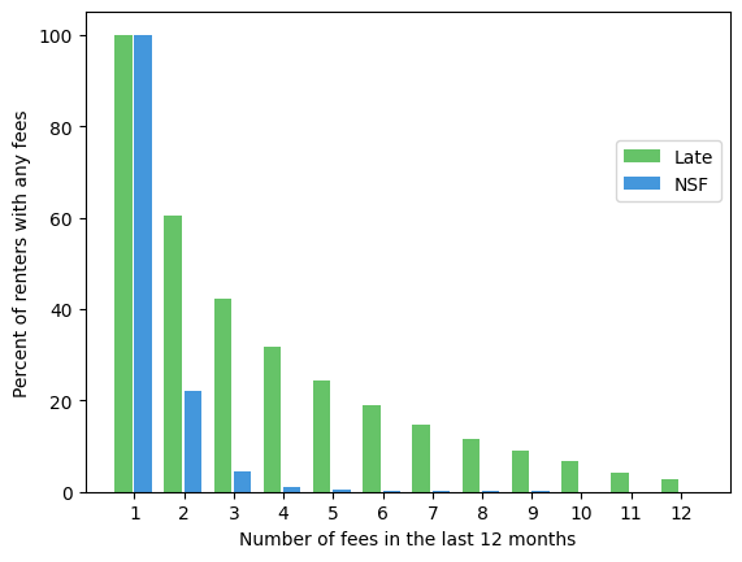
Source: CFPB rental housing payment data
Using these data, we also measure the average fee amount.3 Figure 4 shows the average fee amount for both late and NSF fees over time in nominal terms (i.e., not adjusting for inflation). The average late fee amount has increased from just over $70 in September 2021 to $84 in November of 2024. The average NSF fee amount has remained fairly stable, around $42 for most of the time period.
Figure 4: Average late and NSF fee amounts over time
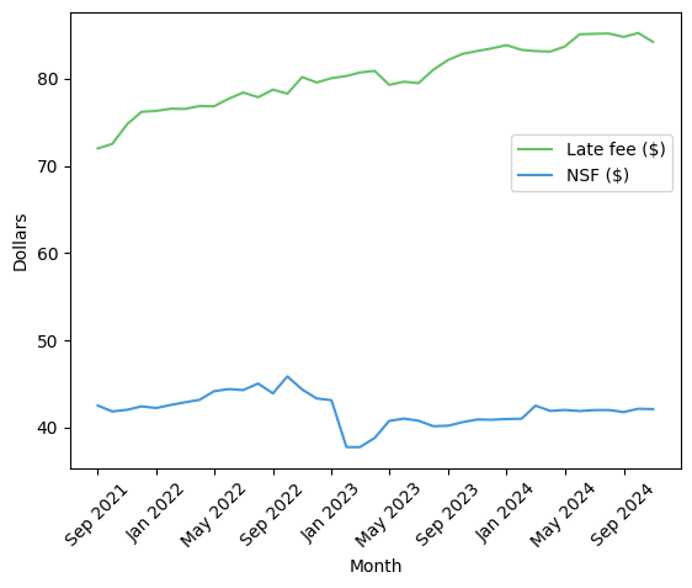
Source: CFPB rental housing payment data
Outstanding balances and write-offs
Above, we showed the rates of active renters with outstanding balances, non-rent write-offs, and rent-write offs. Figure 5, below, plots the median dollar amounts of these three variables in each month, among renters with positive balances or write-off amounts. The median outstanding balance among those with an outstanding balance has increased over time. In September 2021, the median outstanding balance was $2,000, and this increased to $3,200 by November 2024. Though this could indicate increasing balances, it could also be influenced by the composition of renters with outstanding balances. This is occurring while the fraction of renters with an outstanding balance decreased significantly in 2024, as shown above, which could impact the median values conditional on having an outstanding balance. If renters with relatively smaller outstanding balances paid off the balance, for example, then the median could rise among those who continue to have outstanding balances.
The median values of the two write-off categories (conditional on observing positive write-off amounts) increased but leveled off towards the end of our sample time period. The median value of non-rent write-offs increased from around $1,000 in September 2021 to around $1,850 in November 2024. The median value of rent write-offs rose from around $1,000 in 2021 to $1,500 in 2024.
Figure 5: Median values of outstanding balances, non-rent write-offs, and rent write-offs over time
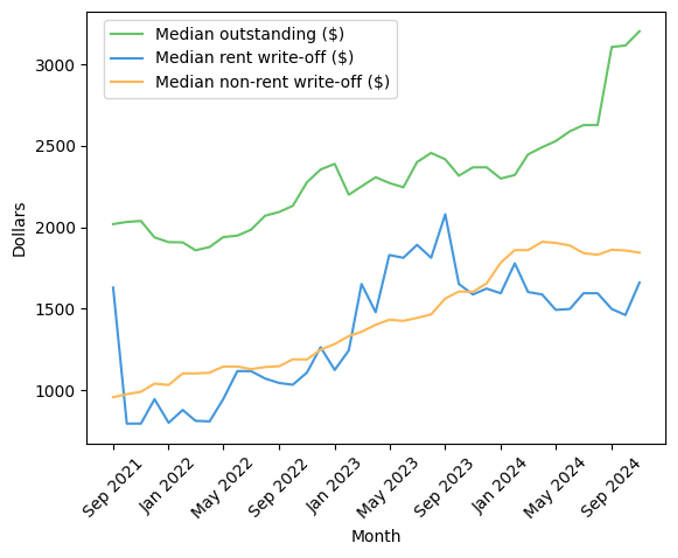
Source: CFPB rental housing payment data
Endnotes
-
According to the U.S. Census Bureau’s 2023 American Community Survey , 34.8 percent of households are renters and for 42.5 percent of these renting households, gross rent payments are 35 percent or more of household income.
↩ -
Notable exceptions are the Federal Reserve Board's annual Survey of Household Economics and Decision-making, The American Housing Survey from the U.S. Census and U.S. Department of Housing and Urban Development, the U.S. Census Bureau’s Household Pulse survey, and the CFPB’s Making Ends Meet survey. The Household Pulse is the only one of these conducted more frequently than annually.
↩ -
Technically, we observe the number of payments and the total amount of payments over the given time frame. We can then calculate the average per payment amount using these.
↩
Page last modified @