New data show improving yet sustained housing insecurity risks
In March 2021, we released an initial report on the effects of the COVID-19 pandemic on housing insecurity . We continue to monitor the market to assess new and developing risks to consumers, and we share updated charts from the report below that show an improving economic picture, yet sustained housing insecurity risks.
As of June 2021, 600,000 fewer consumers were in mortgage forbearance than in January 2021. Forbearance rates noticeably dropped in April when many borrowers exited forbearance after reaching 12-months. This was a positive sign, as many of these borrowers would have been eligible for additional extensions of up to 18 months of total forbearance. A payment deferral, or partial claim, was the most common repayment option. Additionally, foreclosure rates remain at historic lows—as of Q1 2021, 0.54 percent of mortgages were in foreclosure. Since the start of the pandemic, the CARES Act and guidance from the GSEs, FHA, VA, and USDA have prohibited lenders and servicers of GSE and federally-backed loans from beginning or proceeding with foreclosures.
On the other hand, the number of seriously delinquent mortgage borrowers remains nearly three times higher than before the pandemic, with 1.9 million mortgage borrowers more than three months behind on mortgage payments or in active foreclosure. More than one in 10 borrowers with an FHA loan remain seriously delinquent on their mortgage, a rate higher than the peak during the Great Recession. Of the borrowers still in forbearance, many may face a precarious financial situation upon exiting. According to a report from industry , nearly half have been in forbearance for over a year, and another report from industry found that the total amount owed by borrowers in forbearance is almost $90 billion. Employment has begun to trend in a positive direction; however, employment in the leisure and hospitality sector remains 15% below pre-pandemic levels, and the Black-White unemployment gap has increased since December 2020. Our research found that, during the pandemic, mortgage forbearance and delinquency have been significantly more common in communities of color and lower-income communities.
For a more detailed look at the data, please see the charts below:
Updated housing insecurity data
The economy
Figure 1: Percentage change in employment since January 2020 by sector, January 2020 – May 2021
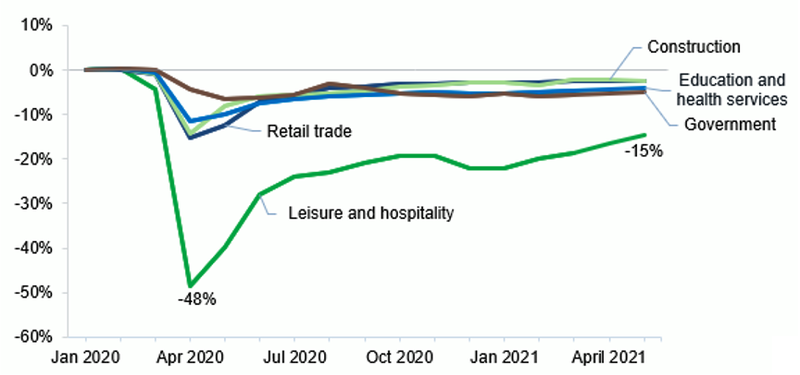
Notes: This chart shows a sample group of employment sectors
Source: CFPB analysis of Bureau of Labor Statistics data
Figure 2: Unemployment by race and ethnicity, January 2020 – May 2021
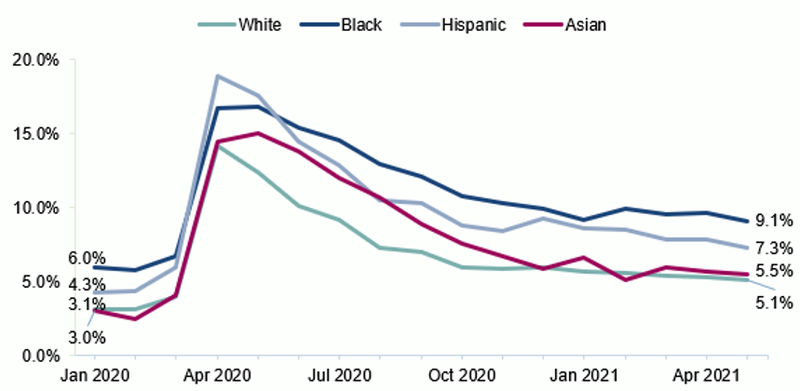
Source: Federal Reserve Bank of St. Louis
Mortgage delinquencies and foreclosures
Figure 3: Mortgage delinquencies comparison by month
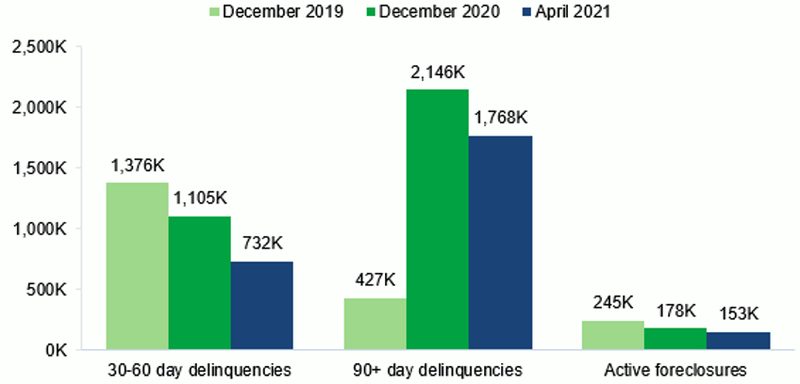
Source: Black Knight Mortgage Monitor, April 2021
Figure 4: Serious mortgage delinquency rate by loan type, Q1 2005 – Q1 2021
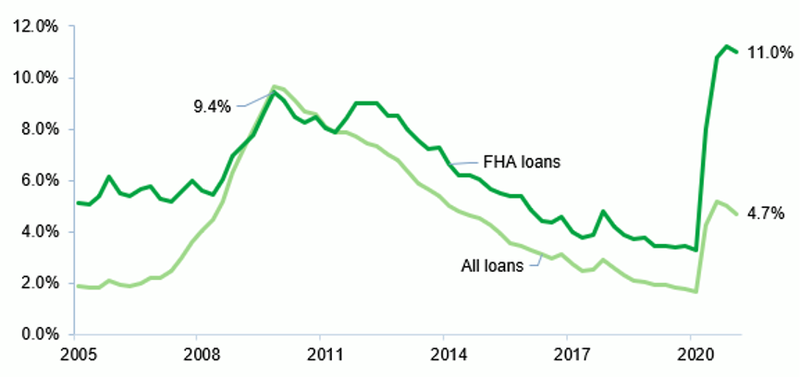
Notes: Not seasonally adjusted, serious mortgage delinquency includes loans 90+ days delinquent and loans in foreclosure
Source: Mortgage Bankers Association, National Delinquency Survey, Q1 2021
Figure 5: Mortgage loans in foreclosure and foreclosure starts, Q1 2005 – Q1 2021
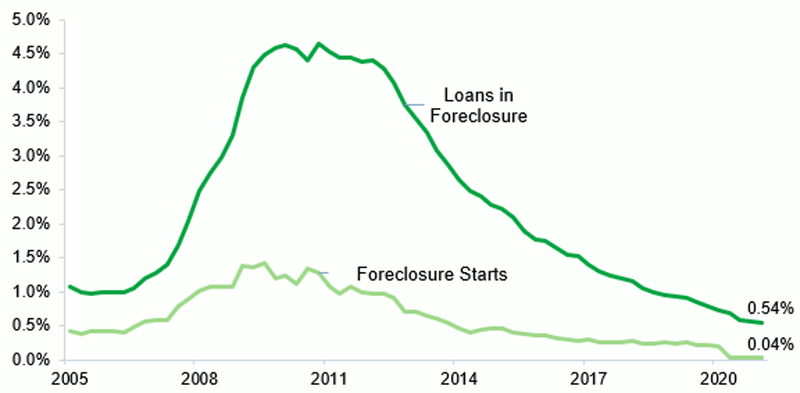
Notes: Not seasonally adjusted
Source: Mortgage Bankers Association, National Delinquency Survey, Q1 2021
Mortgage forbearance
Table 1: Mortgage loans in forbearance by loan type, June 2021
| Metric | Fannie & Freddie | FHA & VA | Other** | Total |
|---|---|---|---|---|
Loans in forbearance* |
656,000 |
859,000 |
609,000 |
2,124,000 |
UPB of Loans in Forbearance ($Bil)* |
$136 |
$146 |
$135 |
$417 |
Share of Loans in Forbearance* |
2.4% |
7.1% |
4.7% |
4.0% |
Active Loan Count (Mil)* |
27.9 |
12.1 |
13.0 |
53.0 |
Notes: *Figures in this table are based on observations from Black Knight’s McDash Flash data set and are extrapolated to estimate the full mortgage market; **Other category includes held in portfolios, private labeled securities, or by other entities
Source: Black Knight Blog, June 2021
Figure 6: Monthly forbearance exits by reason, September 2020 – April 2021
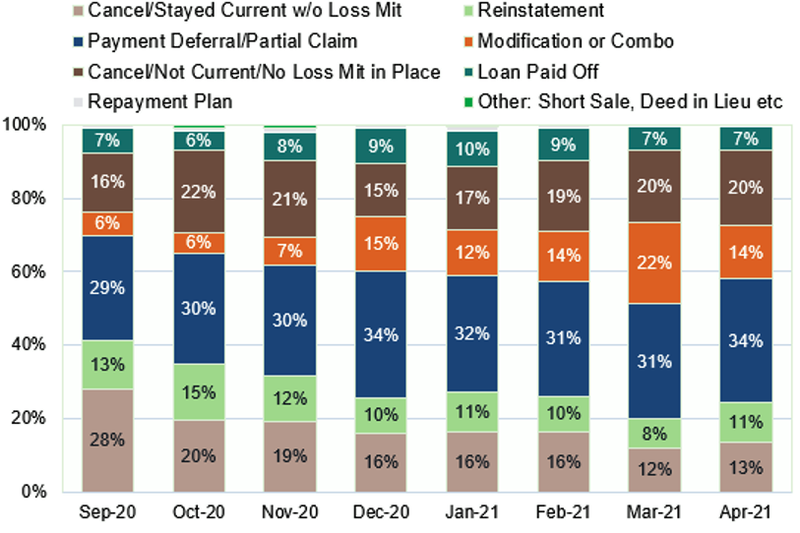
Source: Mortgage Bankers Association Weekly Forbearance and Call Volume Survey, May 2021