Overdraft/NSF revenue down nearly 50% versus pre-pandemic levels
Q4 2022 data suggest over $5.5 billion reduction on annual basis going forward; fees still totaled $7.7 billion in 2022
Offices of Consumer Populations and Markets – MAY 24, 2023
For the past year-and-a-half, CFPB has been closely monitoring trends in overdraft/non-sufficient fund (NSF) fee revenue and practices. With data now available for all four quarters of 2022, we have a fuller picture of reductions in these revenues compared to pre-pandemic levels. Our most recent analysis finds the following:
- Overdraft/NSF revenue for the fourth quarter of 2022 alone was approximately $1.5 billion lower than in the fourth quarter of 2019 – a decrease of 48% compared to before the pandemic, suggesting an annual reduction of over $5.5 billion going forward. This decrease suggests average annual savings of more than $150 per household that incurs overdraft or NSF fees; many households that have typically paid a high number of overdraft or NSF fees annually have saved much more.1
- Even with this substantial reduction, consumers paid over $7.7 billion in 2022 in overdraft/NSF fees.
- Evidence continues to suggest that financial institutions are not increasing other checking account fees to compensate for reduced overdraft/NSF revenue. Across all reporting banks, combined account maintenance and ATM fees remained flat from 2019 to 2022.
This analysis of bank call report data follows our previous analyses of trends in checking account fee revenue published in December 2021, July 2022, and February 2023.
Overdraft/NSF Fee Revenue
Banks with assets over $1 billion have been required to report overdraft/NSF fee revenue in their call report data since 2015. For each of the five years from 2015 to 2019, the overdraft/NSF revenue reported by these banks totaled $11-12 billion annually.2 Bank overdraft/NSF fee revenue was lower in 2020 and 2021 than before the pandemic, likely primarily due to pandemic-related stimulus checks pushing up average checking account balances.3 In the second half of 2021, overdraft/NSF fee revenue rebounded somewhat. However, this revenue began decreasing again in early 2022. The sustained reductions we find in 2022 versus 2019 are likely due to changes in bank policies that started to go into effect toward the end of 2021 and throughout 2022.
For the fourth quarter of 2022 alone, overdraft/NSF revenue was approximately $1.6 billion, compared to roughly $3.1 billion in the fourth quarter of 2019 – a decrease of 48%, or nearly half.4 Overdraft/NSF revenue also trended downward throughout 2022, with quarterly revenue approximating $2.2 billion, $2.0 billion, $1.9 billion, and $1.6 billion for the first through fourth quarters, respectively.5 This quarterly trend further indicates that overdraft/NSF policy changes are impacting bank revenues – especially since, historically, overdraft/NSF revenues in quarters three and four have typically been higher than in quarters one and two.
Figure 1 below compares quarterly 2022 overdraft/NSF revenue to the average quarterly revenue from 2015-2019. These revenues in the first, second, third, and fourth quarters of 2022 were lower than the average from 2015-2019 by 18%, 29%, 38%, and 45% respectively.
FIGURE 1
Quarterly overdraft/NSF revenue, average of 2015-2019 compared to 2022
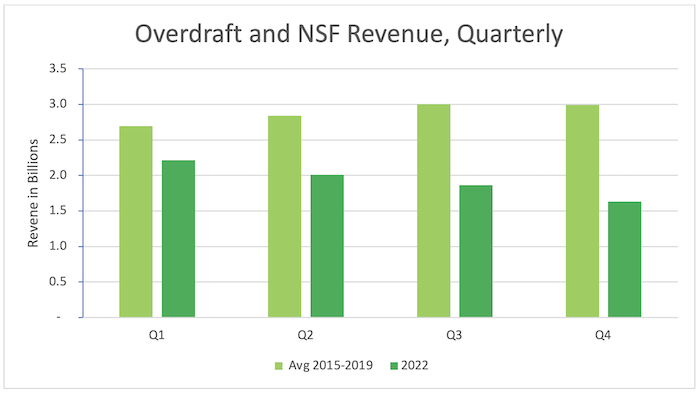
Source: Consolidated Reports of Condition and Income (“Call Reports”), Federal Financial Institutions Examination Council
For the full year 2022, combined overdraft/NSF revenue was $7.72 billion, a decrease of 35% compared to the $11.97 billion reported in 2019.
Figure 2 shows the reported bank overdraft/NSF fee revenue by year, beginning in 2015.
FIGURE 2
Annual overdraft/NSF revenue 2015 to 2022
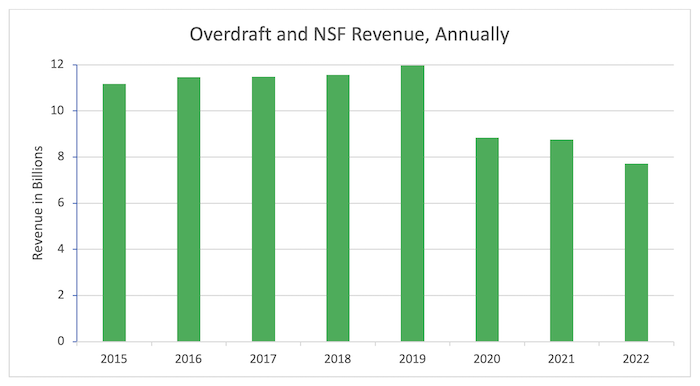
Source: Consolidated Reports of Condition and Income (“Call Reports”), Federal Financial Institutions Examination Council
Despite these declines, reporting banks collected $7.7 billion in overdraft/NSF fees from their customers in 2022. Though banks have made a range of changes to their policies over the last year-and-a-half, some banks continue to charge overdraft fees as high as $37 each. Overdraft fees can total hundreds of dollars per day, exacerbating financial setbacks. And they can lead to account closures, essentially pricing people out of the banking system.
Table 1 below compares overdraft/NSF revenue in 2022 to 2019 across specific banks and groups of banks. The individual banks listed were the largest overdraft/NSF revenue generators in 2021, with each collecting more than $200 million in these fees. Table 1 also shows trends among four groups of banks that generated $200M or less in OD/NSF fee revenue in 2021, consisting mainly of small and midsize banks (referred to as “small/midsize bank groups”).6
Despite the overall decrease in overdraft/NSF fee revenue, we continue to see significant differences across banks and groups of banks. While this evidence is indirect and does not control for changes in the number, composition, or behavior of accountholders, the variations likely reflect, at least in part, changes in overdraft/NSF programs.7
Table 1
Change in overdraft/NSF fee revenue for the year 2022 versus the pre-pandemic year 2019 for select individual banks and groups of banks8
| Individual Banks and Groups of Banks Based on 2021 Overdraft/NSF Revenue | Number of Banks | Group Revenue ($M) Year 2022 | Group Revenue ($M) Year 2019 | $ Change 2022 vs. 2019 | % Change 2022 vs. 2019 |
|---|---|---|---|---|---|
Wells Fargo |
1 |
$1,283 |
$1,696 |
$-413 |
-24% |
JPMorgan Chase |
1 |
1,252 |
2,061 |
-809 |
-39% |
Bank of America |
1 |
392 |
1,563 |
-1,171 |
-75% |
TD Bank |
1 |
389 |
565 |
-176 |
-31% |
Truist |
1 |
366 |
585 |
-219 |
-37% |
Regions |
1 |
283 |
373 |
-90 |
-24% |
U.S. Bank |
1 |
257 |
478 |
-221 |
-46% |
PNC |
1 |
236 |
540 |
-303 |
-56% |
Total of select individual banks |
8 |
$4,458 |
$7,861 |
$-3,403 |
-43% |
$50m to $200m |
11 |
1,112 |
1,736 |
-624 |
-36% |
$10m to $50m |
50 |
1,024 |
1,315 |
-290 |
-22% |
$2m to $10m |
141 |
699 |
717 |
-18 |
-3% |
Under $2m |
418 |
309 |
328 |
-19 |
-6% |
Total |
628 |
$7,602 |
$11,957 |
$-4,355 |
-36% |
The eight individual banks listed in Table 1 all report declines in their overdraft/NSF fee revenue in 2022 relative to 2019. We examine their declines further in Table 2 below. Among categories of banks with lower overdraft/NSF revenue in 2021, the $50-$200 million and $10-$50 million groups saw average declines generally similar to the eight larger banks, of 36% and 22%, respectively. The $2- $10 million and under $2 million groups experienced smaller average declines of 3% and 6%, respectively.
Table 2 below shows the change in overdraft/NSF revenue for the eight individual banks between the fourth quarter alone of 2022 and the fourth quarter alone of 2019. Isolating the fourth quarter allows us to better assess the potential impact these banks’ policy changes, some of which were still being implemented throughout 2022, may be having on their overdraft/NSF revenue.
Table 2
Change in overdraft/NSF fee revenue Q4 2022 versus pre-pandemic Q4 2019 for select individual banks
| Banks | OD/NSF Revenue ($M) Q4 2022 | OD/NSF Revenue ($M) Q4 2019 | $ Change Q422 vs. Q419 | % Change Q422 vs. Q419 |
|---|---|---|---|---|
Wells Fargo |
$251 |
$450 |
$-199 |
-44% |
JPMorgan Chase |
307 |
554 |
-247 |
-45% |
Bank of America |
35 |
402 |
-367 |
-91% |
TD Bank |
53 |
148 |
-95 |
-64% |
Truist |
92 |
149 |
-57 |
-38% |
Regions |
62 |
98 |
-36 |
-37% |
U.S. Bank |
51 |
127 |
-76 |
-60% |
PNC |
60 |
147 |
-87 |
-59% |
Total |
$911 |
$2,075 |
$-1,164 |
-56% |
All of these large banks saw decreases in overdraft/NSF revenue of at least one-third compared to the fourth quarter of 2019, and the total decrease across all eight banks was 56%. Specifically:
- Bank of America experienced the most significant decline by far (91%), which likely reflects the reduction of its overdraft fee to $10, the elimination of overdraft fees on ATM withdrawals, and the elimination of NSF fees, among other changes.
- TD Bank, U.S. Bank, and PNC all experienced declines of over 50%. Among other changes, all three banks have eliminated NSF fees; all three banks have established a grace period until the end of the next day before an overdraft fee is charged; TD Bank and U.S. Bank have implemented $50 negative balance cushions; and PNC has implemented a limit of one overdraft fee per day.
- JPMorgan Chase and Wells Fargo experienced 45% and 44% declines, respectively. Both banks eliminated NSF fees and introduced a grace period until the end of the next day before an overdraft fee is charged. JPMC also now has a $50 negative balance cushion.
- Truist (38%) and Regions (37%) experienced relatively smaller declines. Both banks eliminated NSF fees.
For the first time, we are also analyzing the change in overdraft/NSF revenue at the individual bank level for the 11 banks that reported between $50 million and $200 million in overdraft/NSF revenue in 2021, reflected in Table 3 below.
Table 3
Change in overdraft/NSF fee revenue Q4 2022 versus pre-pandemic Q4 2019 for banks that earned between $50 and $200 million in overdraft/NSF fee revenue in 2021
| Banks | OD/NSF Revenue ($M) Q4 2022 | OD/NSF Revenue ($M) Q4 2019 | $ Change Q422 vs. Q419 | % Change Q422 vs. Q419 |
|---|---|---|---|---|
USAA |
47 |
60 |
-13 |
-21% |
Huntington |
23 |
67 |
-44 |
-66% |
Citizens |
27 |
56 |
-29 |
-51% |
Woodforest |
31 |
40 |
-9 |
-22% |
KeyBank |
16 |
39 |
-23 |
-60% |
First National Bank Texas/First Convenience Bank |
91 |
113 |
-22 |
-19% |
Fifth Third |
26 |
34 |
-8 |
-24% |
M&T |
9 |
41 |
-32 |
-77% |
Citibank |
0 |
29 |
-29 |
-100% |
Capital One |
0 |
39 |
-39 |
-100% |
Arvest |
18 |
24 |
-6 |
-24% |
Total |
$288 |
$542 |
-$254 |
-47% |
Capital One and Citibank have both eliminated overdraft and NSF fees entirely, reflected in their 100% drop in associated revenue compared to the fourth quarter of 2019. USAA experienced a 21% decline, although it does not charge overdraft fees and announced that it would eliminate NSF fees by the end of 2022. M&T’s revenues have dropped 77%, likely reflecting the reduction of its overdraft fee to $15 and a limit of one overdraft fee per day, along with elimination of NSF fees. Huntington and KeyBank’s revenues fell 66% and 60%, respectively; Huntington reduced its overdraft fee to $15 among other changes, while KeyBank reduced its overdraft fee to $20 and eliminated NSF fees, among other changes. Citizens’ fees dropped 51%; it began offering a grace period until the end of the next day and eliminated NSF fees, among other changes. Fifth Third, Arvest, and Woodforest experienced smaller declines ranging from 22-24%; all of those banks announced elimination of NSF fees, among other changes. First National Bank Texas/First Convenience Bank experienced the smallest decline at 19%.
Other Listed (Maintenance and ATM) Fee Revenue
We also continue to examine other checking account fee revenue, in part to determine whether these fees may be increasing to replace reduced overdraft/NSF revenue. Call reports require banks to list consumer deposit account revenue from three sources: 1) combined overdraft and NSF fees, 2) periodic maintenance fees, and 3) ATM fees. We refer to these three types of fees as “listed fees.” In Table 4 (structured similarly to Table 1), we report changes in listed fees other than overdraft/NSF fees – i.e., maintenance and ATM fees. As with prior analyses, we do not identify a clear correlation between declines in overdraft/NSF fee revenue and increases in other listed fee revenue.
Table 4
Change in other listed fee revenue (maintenance fees and ATM fees) for the year 2022 versus the pre-pandemic year 2019 for select individual banks and groups of banks9
| Individual Banks and Groups of Banks Based on 2021 Overdraft/NSF Revenue | Number of Banks | Group Revenue ($M) Year 2022 | Group Revenue ($M) Year 2019 | $ Change 2022 vs. 2019 | % Change 2022 vs. 2019 |
|---|---|---|---|---|---|
Wells Fargo |
1 |
$877 |
$884 |
$-7 |
-1% |
JPMorgan Chase |
1 |
1,088 |
928 |
160 |
17% |
Bank of America |
1 |
1,360 |
1,467 |
-107 |
-7% |
TD Bank |
1 |
335 |
302 |
33 |
11% |
Truist |
1 |
182 |
206 |
-24 |
-12% |
Regions |
1 |
111 |
108 |
3 |
3% |
U.S. Bank |
1 |
202 |
215 |
-13 |
-6% |
PNC |
1 |
239 |
186 |
52 |
28% |
Total of select individual banks |
8 |
$4,394 |
$4,296 |
97 |
2% |
$50m to $200m |
11 |
579 |
684 |
-105 |
-15% |
$10m to $50m |
50 |
514 |
562 |
-48 |
-9% |
$2m to $10m |
141 |
301 |
263 |
38 |
15% |
Under $2m |
418 |
198 |
183 |
15 |
8% |
Total |
628 |
$5,987 |
$5,989 |
$-2 |
0% |
Among the eight larger individual banks, compared to the pre-pandemic 2019 baseline, there was a divergence of experiences in other listed fee revenue. However, there is no clear correlation between decreases in overdraft/NSF and increases in other listed fee revenue. Of the four banks with the most significant declines in overdraft/NSF fee revenue, Bank of America’s other listed fee revenue dropped 7%, while TD Bank’s increased 11%, U.S. Bank’s fell 6%, and PNC’s increased 28%. In terms of dollar amounts, the declines in overdraft/NSF fee revenue across all eight banks in 2022 ($3.4 billion) far exceeded the net increase in other listed fee revenue ($97 million).
Banks with $50-$200 million and banks with $10-$50 million in 2021 overdraft/NSF revenue, on average, reported less revenue from other listed fees than before the pandemic; in contrast, banks with $2-$10 million and under $2 million in 2021 overdraft/NSF revenue saw increases. Across all reporting banks, other listed fee revenue remained flat from 2019 to 2022, even as overdraft/NSF fee revenue decreased by $4.4 billion. It is worth noting that banks’ net interest income as a portion of combined interest and non-interest income increased from an average of 67.5% in 2019 to 68.3% in 2022, and throughout 2022 increased from 64.3% in the first quarter to 74.1% in the fourth quarter.10
We will continue to track overdraft/NSF fees and are considering rulemaking activities related to these fees. We will also continue to follow other listed fees to discern to what extent these fees might create barriers to account access.
For our latest review of overdraft/NSF policies, please see the most recent table tracking overdraft fees and policies across banks, as well as the most recent chart on NSF fee practices. For further discussion of trends in these practices, see our February 2022 analysis, April 2022 analysis, July 2022 analysis, and February 2023 analysis.
Endnotes
- Surveys prior to the pandemic found that approximately 25% of households overdrew their checking account, which amounts to roughly 33 million households. $5.5 billion in reduced fees divided by 33 million households equals $167 per household per year. Overdraft and NSF fees are not evenly distributed across households that overdraft, however. CFPB has previously found that nearly 80% of combined overdraft and NSF fees were shouldered by under 9% of accountholders who had more than 10 overdrafts annually. Thus, many households that have typically incurred a high number of overdraft or NSF fees have saved more than the average savings per household.
- This revenue excludes overdraft/NSF revenue generated by banks with assets of $1 billion or less, which are not required to report overdraft/NSF fee revenue as a separate line item in their call report data, as well as overdraft/NSF revenue generated by all credit unions. Because some banks do not report in all years, some of the year-to-year variation in overdraft revenue reflects changes in the set of reporting banks.
- JPMC Institute, Household Pulse: The State of Cash Balances through March 2022.
- The fourth quarter call report data for both 2022 and 2019 reflect additional banks reporting overdraft/NSF revenue, relative to the prior three quarters, because certain banks (currently those with assets less than $5 billion) are required to break out overdraft/NSF revenue only annually, not quarterly. Thus, some banks report all of their annual overdraft/NSF revenue in the fourth quarter. In total, such revenue reflects 5% of the total 2022 overdraft/NSF revenue reported and 2.1% of the total 2019 overdraft/NSF revenue reported. To estimate quarterly revenue for 2022 and 2019 with the benefit of the full year’s data, we allocate the annual reporters’ revenue to each quarter evenly, by applying one-fourth of it to each quarter.
- Footnote 4 above describes the methodology applied here.
- We define two groups of small banks, those collecting under $2 million and those collecting $2 million to $10 million in overdraft/NSF fee revenue in 2021, and two groups of midsized banks, those collecting $10 million to $50 million and those collecting $50 million to $200 million in overdraft/NSF fee revenue in 2021. Since our focus is exclusively on fee revenues, we use this categorization as opposed to the more common categorization by asset size. This is because overdraft/NSF revenue and asset size are strongly but not perfectly correlated. This means that some banks that are categorized as midsize banks here based on their overdraft/NSF revenue may not be midsize based on their assets. Conversely, some banks that are categorized as small banks here based on their overdraft/NSF revenue may not be small based on their assets.
- It is important to note that there are significant drivers of fee revenues besides bank overdraft program settings. An important one is the number of accounts consumers hold at a bank. While we merger-adjust the data, there can be significant changes in the number of accounts held at a bank even without mergers. We cannot examine this further since call reports do not require banks to report the number of consumer checking accounts they hold.
- The data construction for Table 1 is the same as in our Dec 2021 report; please see that report for details. The table restricts data to banks that reported listed fees during 2022. The number of banks reflected in this table is larger than the number reflected in our February 2023 and July 2022 analyses because this table, based on year-end data, includes those banks that only break out their overdraft/NSF revenue annually. The prior analyses were of quarter-end data, not year-end data, so they included only those banks that break out their overdraft/NSF revenue quarterly.
- The data construction for Table 4 is the same as in our Dec 2021 report; please see that report for details. The table restricts data to banks that reported listed fees during 2022. The number of banks reflected in this table is larger than the number reflected in our February 2023 and July 2022 analyses because this table, based on year-end data, includes those banks that only break out their listed fee revenue annually. The prior analyses were of quarter-end data, not year-end data, so they included only those banks that break out their listed fee revenue quarterly.
- We also note that, as with overdraft/NSF fee revenue, there are a number of factors that could influence other listed fee revenues, making it difficult to isolate the impacts of any policy changes, or lack thereof, without further analysis. The increase in savings during the pandemic led to higher average account balances, which could be resulting in fewer accounts being assessed minimum balance maintenance fees, in addition to fewer instances of overdraft and NSFs. On its own, this increase in average account balances may have caused a reduction in other listed fees, which may rebound as account balances return to more normal levels. Other factors, including growth in the number of accounts, would have the opposite effect.
Page last modified @