Financial challenges faced by recently widowed older adults
By the CFPB Office for Older Americans – MAY 26, 2022
Contact the Office for Older Americans: olderamericans@cfpb.gov
Over 1.2 million adults ages 60 and older lost a spouse in 2019. Many recently widowed older adults own their homes with significant home equity, and a third of them spent at least 30 percent of their income on housing. Newly widowed older adults also face higher poverty rates and challenges to getting the help they need. Using public data from the Census American Community Survey, this spotlight describes key demographic characteristics and the financial circumstances of older surviving spouses to highlight opportunities for improving the financial well-being of this population.
Over 1.2 million adults ages 60 and older lost a spouse in 2019
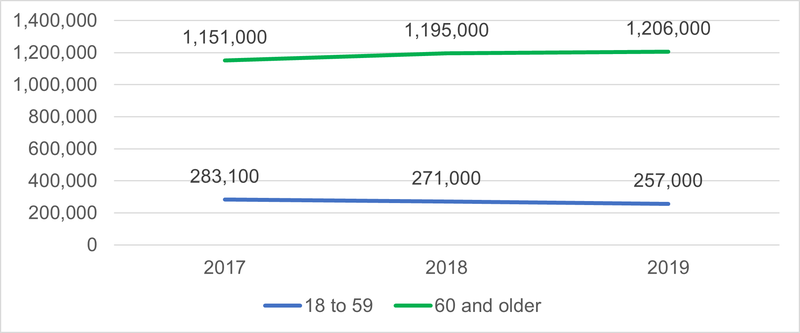
According to the 2019 American Community Survey, nearly 1.5 million adults lost a spouse in 2019, and 82 percent (over 1.2 million) were ages 60 and older. The number of recently widowed older adults increased by 5 percent between 2017 and 2019 from 1,151,000 in 2017 to 1,206,000 in 2019. In contrast, the analysis shows that the number of new surviving spouses ages 18 to 59 declined by 9 percent from 283,100 in 2017 to 257,000 in 2019. These trends do not show the impact of COVID-19. Data collected during the COVID-19 pandemic in 2020 and 2021 will likely reveal a short-term spike in the number of new surviving spouses, particularly among the older adult population, who experienced the overwhelming majority of pandemic fatalities.1
Figure 1
Pre-pandemic trends in the number of adults ages 18 and older who lost a spouse in the past 12 months
Source: CFPB analysis of Census Bureau American Community Survey 1-Year Estimates-Public Use Microdata Sample at https://data.census.gov/mdat/#/ . See About the Census American Community Survey section for more details on the data and methodology.
These new surviving spouses (1.6 percent of all older adults) join the ranks of 13.4 million widow(er)s who lost a spouse in prior years. As the number of adults ages 60 and older increases, the number of older surviving spouses can also be expected to grow each year.
The number of people experiencing this life event exceeds the population of several states.2 The CFPB is committed to ensuring that surviving spouses are treated fairly in the consumer financial marketplace, particularly those who are dealing with mortgage, student loan, medical, or credit card debt.3
Complaints submitted to the CFPB by older consumers provide some insights into the financial challenges that surviving spouses face. In consumer complaints, surviving spouses have explained that the loss of a spouse’s income makes it more difficult for them to meet their debt obligations. Surviving spouses also have reported attempts to collect credit card debt they do not owe.
Insights from complaints submitted to the CFPB by older consumers
"I am unable to pay this debt, as I am faced with both the loss of income from my husband's death and my own income due to the COVID-19 Pandemic. I am working hard to pay my own credit accounts and that is all I can do. I requested that the amount owed on this … card be reduced or that interest accrual be stopped so that I had some chance of paying the balance incrementally."
"I am an older widow who contacted a credit card company after my husband passed away. I explained that the bills coming were for a credit card issued to him, not to me. The original paperwork shows the card belonged to him. No charges had been made to the card in the years prior to his death. Now, the credit card company has added my name to the card without asking permission. In turn, I have been paying the bills as they come in, now paying over $5000.00 on a $4000.00 balance."
"My husband died recently and I have been disputing a "joint" status on a credit card for many years. I called the card company and advised them of his death and then I demanded to see a credit application with my signature. I have the original paperwork and it's in my husband's name only. He has no estate. They have not sent the documentation. Instead, they sent a new statement in my name only."
Surviving spouses are more likely to be women, over the age of 80, living alone, and not currently employed
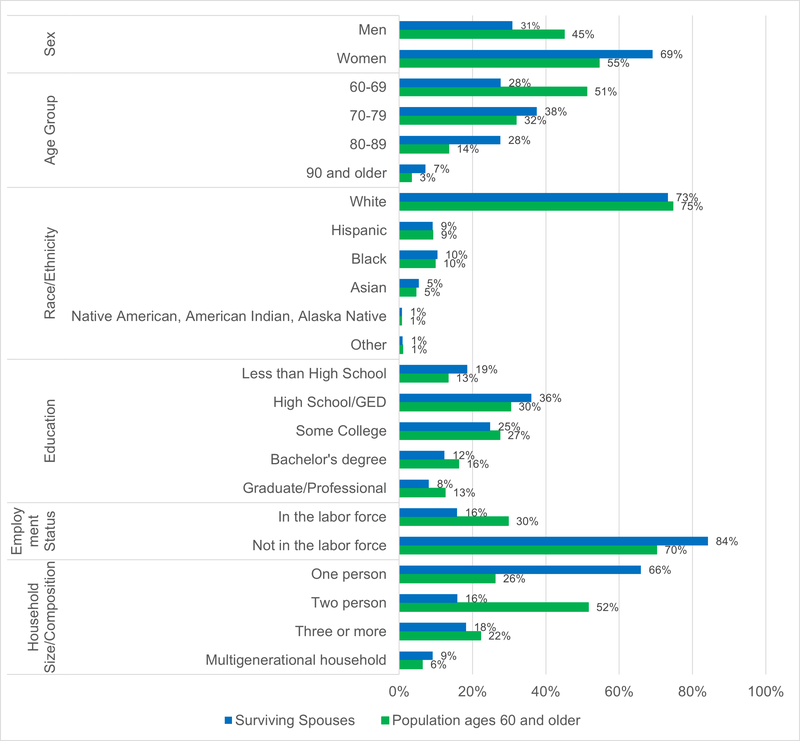
Surviving spouses’ demographic, social, and household profiles differ significantly from the general population ages 60 and older. Surviving spouses are more than twice as likely to be women as they are to be men. More than one third of surviving spouses are over the age of 80, compared to less than one fifth of the general older adult population. Surviving spouses age 60 and older are also less likely to be in the labor force than their peers. Finally, surviving spouses are more likely to live alone than older adults generally. Yet as noted below about one-third of them live with other people, which in most cases is an adult child.
The racial and ethnic characteristics of new surviving spouses normally track those of the general population. However, as the result of the COVID-19 pandemic’s disproportionate impact on the oldest segment of the population as well as in certain racial groups, data for 2020 and 2021 may reveal a demographic shift in the profile of older surviving spouses.
Figure 2
Demographic, social and household characteristics of the older population and older surviving spouses, 2019
Source: CFPB analysis of Census Bureau American Community Survey 1-Year Estimates-Public Use Microdata Sample at https://data.census.gov/mdat/#/ . See About the Census American Community Survey section for more details on the data and methodology.
Among newly widowed older adults, one quarter of homeowners face mortgage debt, and nearly 70 percent of renters face high housing costs
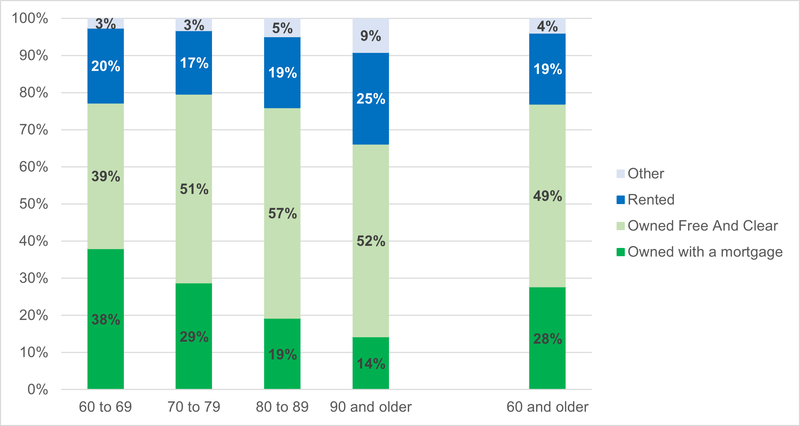
Approximately 77 percent of surviving spouses own their homes, 19 percent are renters, and 4 percent live in other arrangements such as rent-free with family members or in group quarters like nursing homes. Among homeowning surviving spouses, 27 percent own their homes with a mortgage. The percentage of surviving spouses with a mortgage declines with age from 38 percent at ages 60 to 69, to 14 percent at ages 90 and older. New surviving spouses, on average, own homes worth $285,000.
Figure 3
Housing situations of newly widowed older adults, 2019
Source: CFPB analysis of Census Bureau American Community Survey 1-Year Estimates-Public Use Microdata Sample using MDAT at https://data.census.gov/mdat/#/ . See About the Census American Community Survey section for more details on the data and methodology.
In general, older surviving spouses face greater housing burdens than the general population of adults ages 60 and older, as measured by the percent spending 30 percent or more of their income on housing. Among widowed homeowners, 35 percent spent 30 percent or more of their income on housing costs compared to 22 percent of homeowners in the general older population.
Among older renters, 67 percent of new surviving spouses spent 30 percent or more of their income in housing compared to 57 percent of all older adults. These pre-pandemic findings reflect high rates of housing insecurity among recently widowed individuals heading into the COVID-19 pandemic, which research shows generally exacerbated insecurity and housing costs for many older renters and homeowners.4
High home equity combined with high housing burden makes new surviving spouses who want to stay in their homes attractive targets for financial products that promise to alleviate their housing burden by leveraging their home equity. The CFPB will continue monitoring the marketplace to ensure that deceptive and abusive practices are not used to sell equity release products that (i) do not meet the needs of the older adults as they age, (ii) strips them of their home equity, or (iii) further increases their housing burden or level of insecurity.
Surviving spouses face higher poverty rates, but they are less likely to get help with food and healthcare costs
A large number of studies have documented the impact of widowhood on the income of surviving spouses, with newly widowed individuals experiencing an average income drop of 11 percent even after accounting for household size and reduced needs.5
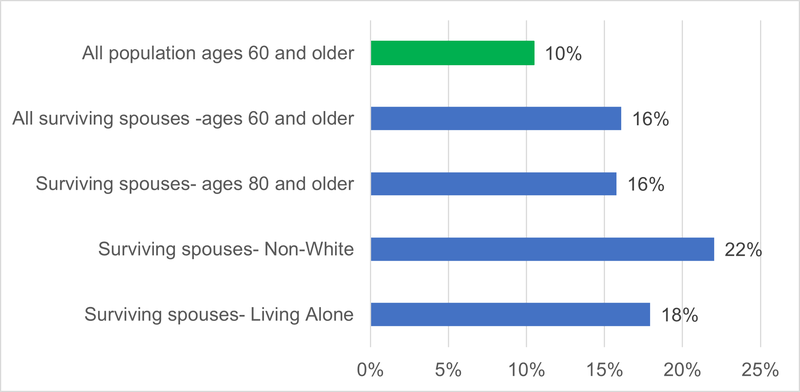
Compared to the population ages 60 and older who have not recently lost a spouse, a greater share of newly surviving spouses face poverty.6 Specifically, 16 percent of new surviving spouses have income below the federal poverty level (approximately $12,300 for a one-person household) compared to 10 percent of all older adults aged 60 and older. Poverty rates are significantly higher among non-White older surviving spouses and slightly higher among those living alone.
Figure 4
Comparison of poverty rates between adults ages 60 and older and new surviving spouses, 2019
Source: CFPB analysis of Census Bureau American Community Survey 1-Year Estimates-Public Use Microdata Sample using MDAT at https://data.census.gov/mdat/#/ . See About the Census American Community Survey section for more details on the data and methodology.
The analysis suggests that there are missed opportunities to help low-income surviving spouses. For example, newly widowed older adults with incomes below the poverty line are likely to qualify for both the Supplemental Nutrition Assistance Program (SNAP) and Medicaid. Yet the analysis shows that more than half (58 percent) are enrolled in neither program. Surviving spouses are likely to interact with a variety of federal and state agencies as they address legal and financial matters related to their deceased spouse. These interactions provide an opportunity for benefits screening or referral to address the underutilization of benefits.
Surviving spouses face greater barriers to accessing information and help
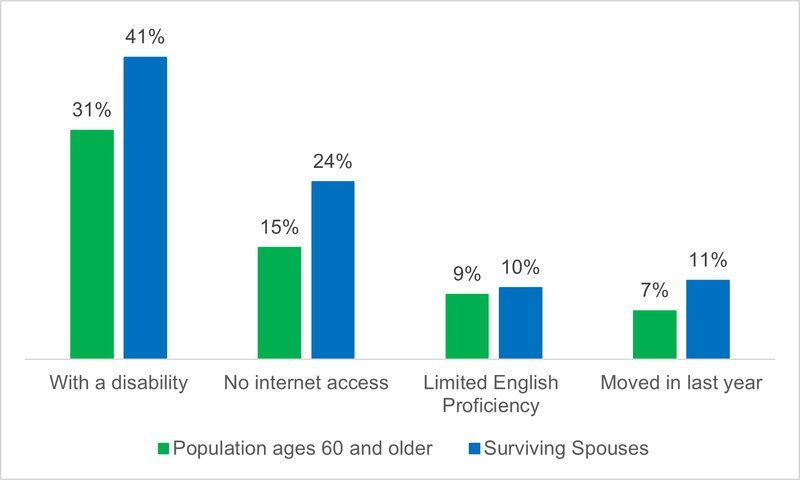
Disability, lack of internet access, limited English proficiency, and the experience of moving to a new community can all affect older adults’ access to critical support. All of these challenges affect surviving spouses at a greater rate than their peers. For instance, in 2019, 41 percent of new surviving spouses had at least one disability, compared to 31 percent in the general older adult population. Among these surviving spouses living with a disability, 20 percent experienced a vision-related disability and 38 percent had a hearing-related disability. In addition, 24 percent of newly widowed older adults lacked any access to the internet, compared to 15 percent of the general older population. 10 percent reported limited English proficiency, compared to 9 percent of the general older population, and 11 percent moved the same year they experienced the loss of a spouse, compared to 7 percent of their peers.
Figure 5
Challenges to access information and help, 2019
Source: CFPB analysis of Census Bureau American Community Survey 1-Year Estimates 1-Year Estimates-Public Use Microdata Sample (MDAT) at https://data.census.gov/mdat/#/ . See About the Census American Community Survey section for more details on the data and methodology.
Policy, programmatic and educational interventions must take these challenges into account. In order to be effective, interventions also must involve family caregivers, community organizations, and social service providers (such as service coordinators in federally-subsidized housing) who provide critical support to these older adults.
Help is available
From the CFPB:
Financial workbook for surviving spouses: Figuring out how to manage your finances, on top of the grief of losing a spouse may feel overwhelming. This step-by-step guide is designed to help you do the most important and pressing things first.
Consumer guide, When a loved one dies and debt collectors come calling: It’s quite common for newly widowed older adults to face debt collection while they are still grieving. Read CFPB’s new consumer guide or learn about your debt collection rights as a survivor on Ask CFPB.
Submit a complaint: If you are having trouble with a financial product or service and have already tried reaching out to the company and still have an issue, you can submit a complaint. Tell us about your issue—we'll forward it to the company and work to get you a response, generally within 15 days.
Endnotes
- For more data on COVID-19 deaths by race/ethnicity and age, see https://www.cdc.gov/nchs/nvss/vsrr/covid19/health_disparities.htm#RaceHispanicOriginAge
- In 2019, eight states (Alaska, Delaware, Montana, North Dakota, Rhode Island, South Dakota, Vermont and Wyoming) and the District of Columbia had a total population of less than 1.2 million people. See, U.S. Census Bureau, Estimates of the Total Resident Population and Resident Population Age 18 Years and Older for the United States, States, and Puerto Rico: July 1, 2019 (SCPRC-EST2019-18+POP-RES) https://www2.census.gov/programs-surveys/popest/tables/2010-2019/state/detail/SCPRC-EST2019-18%2BPOP-RES.xlsx
- For example, if a mortgage borrower dies, existing CFPB rules require that servicers have policies and procedures in place to promptly identify and communicate with family members, heirs, or other parties, known as ‘successors in interest,’ who have a legal interest in the home. Confirmed successors in interest will generally receive the same protections under the CFPB’s mortgage servicing rules as the original borrower.
- See, e.g. CFPB, Housing insecurity and the COVID-19 pandemic (2021), available at https://www.consumerfinance.gov/data-research/research-reports/housing-insecurity-and-the-covid-19-pandemic/; Scheckler, S and Airgood-Obrycki, W., Making Rent in the Pandemic: How are Older Adult Households Faring? (2020) https://www.jchs.harvard.edu/blog/older-adult-households-and-the-economic-impacts-of-the-pandemic
- Itzik Fadlon , Shanthi Ramnath , Patricia K. Tong , Lisa Camner McKay, Financial Life After the Death of a Spouse, Chicago Fed Letter, No. 438, (May 2020) https://www.chicagofed.org/publications/chicago-fed-letter/2020/438
- U.S. Census Bureau, Poverty Thresholds, https://www.census.gov/data/tables/time-series/demo/income-poverty/historical-poverty-thresholds.html
Page last modified @