Data Spotlight: Financial well-being in America, from 2017 to 2020
In 2017, CFPB published its first report on Financial Well-Being in America. Since then, the financial circumstances of many Americans have changed dramatically. This spotlight shows that Americans experienced an average increase in their financial well-being between 2017 and 2020, likely boosted by the large government response to the COVID-19 pandemic. Yet, a deeper analysis shows that the largest increases were experienced by those with higher incomes, and that approximately one-third of Americans saw a decline in their financial well-being.
Measuring the financial well-being of Americans
Financial well-being is a state of being wherein a person can fully meet current and ongoing financial obligations, can feel secure in their financial future, and is able to make choices that allow them to enjoy life.
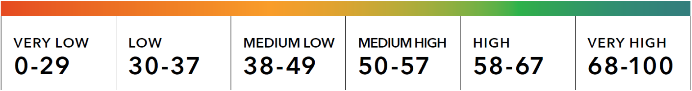
The Consumer Financial Protection Bureau (CFPB) developed, validated, and tested the Financial Well-Being Scale to reliably and consistently measure how people feel about their financial security and freedom of choice. It is grounded in a person’s day-to-day financial experiences, as well as how their individual circumstances impact their ability to meet personal financial goals. The CFPB Financial Well-Being Scale yields a financial well-being score, a single number between 0 and 100, that provides a holistic view of a person’s financial well-being. The scores are grouped in six categorical ranges from very low to very high.1
Financial Well-Being Score ranges
Many of today’s consumers are facing challenges due to the COVID-19 pandemic. Their financial well-being was impacted by job loss, lack of mobility and the life and death health risks associated with the virus. Understanding how financial well-being may have changed in response to these dynamics is important for policymakers, and it may help to encourage effective policies and services.
On average, financial well-being of U.S. adults increased slightly between 2017 and 2020, yet 1 in 10 Americans had low or very low levels of financial well-being.
From 2017 to 2020, the average financial well-being score for U.S. adults increased by one point, from 54 to 55. As shown in Figure 1, the number of U.S. adults with high or very high financial well-being increased from 38 percent to 42 percent while the proportion with low or very low financial well-being decreased from 13 percent to 10 percent.
Figure 1: Distribution of U.S. adults across financial well-being score ranges by year
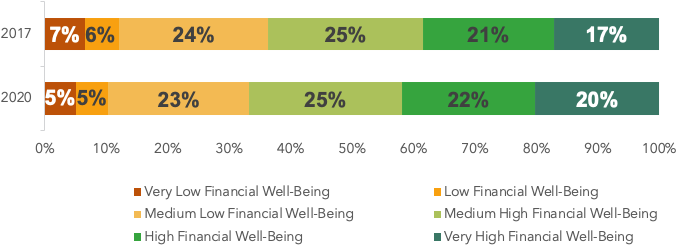
Source: CFPB analysis of the Federal Reserve Board’s Survey of Household Economics and Decision-making. See Methodology for more details.
This increase aligns with prior CFPB research examining the finances of Americans before and during the early months of the pandemic, and suggests that the robust government response to the pandemic−including stimulus payments, expanded unemployment benefits, and mortgage and student loan forbearance−may have prevented financial difficulties for many families, despite widespread economic uncertainty and a spike in unemployment.
At the same time, 10 percent of adults still reported having low or very low levels of financial well-being (Figure 1). This score identifies individuals who experience the most severe financial and material hardships, including housing and food insecurity.2
Despite a national average increase, over a third of U.S. adults experienced a decline in financial well-being from 2017 to 2020.
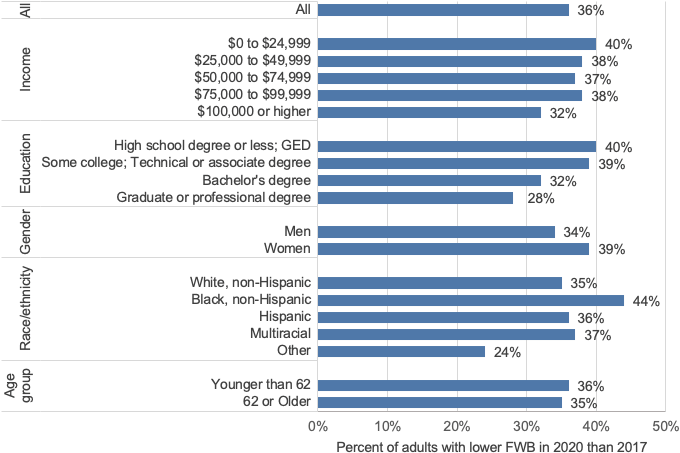
While average financial well-being increased for U.S. adults and across demographic characteristics, 36 percent of U.S. adults reported having lower financial well-being in 2020 than in 2017. When broken down into specific characteristics − such as income, education, gender, race/ethnicity, and age − almost 40 percent of respondents that reported a decline in financial well-being were individuals with incomes of less than $25,000, individuals without a bachelor’s degree or greater, women, and Black/non-Hispanic adults (Figure 2).
Figure 2: Percent with decrease in financial well-being score from 2017 to 2020 by selected demographic characteristics
Negative financial experiences or circumstances related to credit and banking were higher among adults with low or very low financial well-being.
No single financial experience defines the financial situation of Americans who report low levels of financial well-being. It can be driven by several factors, including issues outside of the financial domain, such as lack of family or community support, or health challenges. However, certain financial circumstances or experiences are more common among adults with the lowest scores. For example, in 2020, and consistent with prior CFPB research,3 people with the lowest scores were at least two or more times likely than the general population to: lack emergency savings, be unable to pay all bills in the month, have medical debt, and describe the economic conditions of their community as “poor”. They are also more likely to report using alternative financial services in the past 12 months, feeling discriminated against by financial institutions, being turned down for credit, as well as a wide range of other negative credit or banking-related experiences.
Figure 3: Comparison of the percent of adults with low financial well-being and adults in the general population that reported specific financial experiences or circumstances, 2020
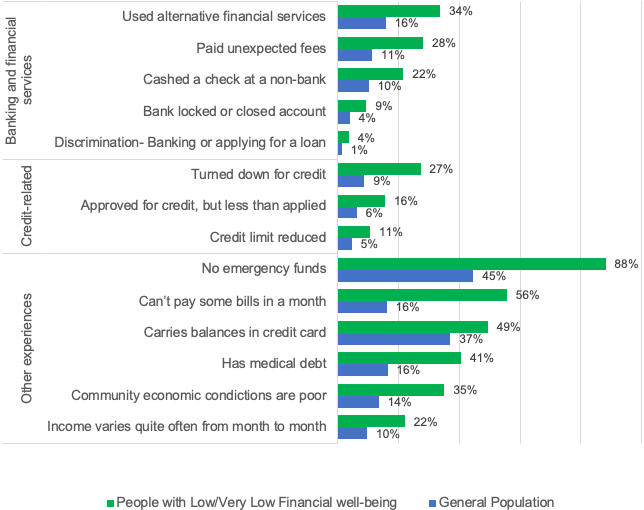
Source: CFPB analysis of the Federal Reserve Board’s Survey of Household Economics and Decision-making. See Methodology for more details.
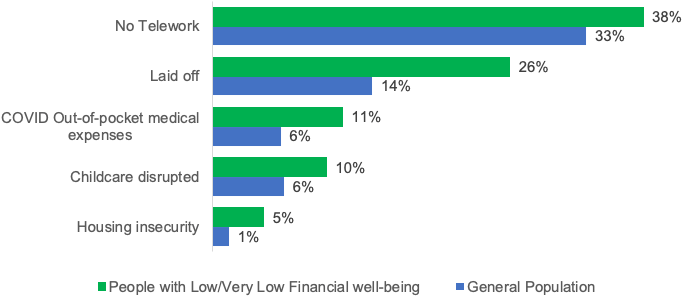
People with low or very low financial well-being were more likely to face key pandemic-specific challenges.
People with the lowest levels of financial well-being were more susceptible to the financial struggles many Americans faced during the pandemic. Particularly, individuals who scored low or very low were more likely to face out-of-pocket medical expenses due to the pandemic, to be laid off, or to have a childcare disruption due to not being able to work from home. Additionally, this segment of adults were especially more likely to experience housing insecurity due to the inability to pay their mortgages and rent. Specifically, five percent of adults with low and very low financial well-being reported moving out of their homes due to immediate or future foreclosure or eviction, compared to only one percent of the general population (Figure 4). These findings reinforce the importance of CFPB efforts and continued interagency focus during the height of the pandemic to protect consumers from unfair actions that deny individuals the assistance needed to prevent foreclosure, evictions, and ultimately homelessness.
Figure 4: Comparison of the percentage of adults with low financial well-being and adults in the general population that reported specific COVID-19-related challenges, 2020
Source: CFPB analysis of the Federal Reserve Board’s Survey of Household Economics and Decision-making. See Methodology for more details.
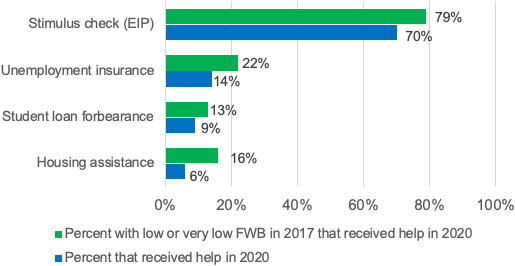
People with low or very low financial well-being in 2017 were more likely than the general population to receive government financial support in 2020.
Government support during the COVID-19 pandemic - such as the Coronavirus Aid, Relief, and Economic Security Act (CARES Act), Economic Impact Payments (EIP), and other government relief packages provided financial support to a variety of groups who struggled during the pandemic. Assistance was targeted to boost the economy, to increase consumer spending, and to help groups who faced economic hardship, like job loss or housing insecurity. Analysis shows that adults with low or very low financial well-being in 2017 were more likely than the general population to receive a wide range of government assistance during the pandemic. For example, Figure 5 shows that 70 percent of U.S. adults received a stimulus check in 2020, but 79 percent of U.S. adults, who had low or very low financial well-being in 2017, received a stimulus check.4 Furthermore, adults who had low or very low financial well-being prior to the pandemic were also more likely to receive unemployment insurance, forbearance, and other housing assistance. Further research is needed to understand the effects of government financial assistance and whether higher average financial well-being scores persisted after 2020. These findings, which aligns with other CFPB research , suggest that the CARES Act programs reached Americans with the greatest need during the pandemic.
Figure 5: Comparison of the percentage of general population that received financial assistance in 2020 and adults with low financial well-being that received financial assistance in 2020
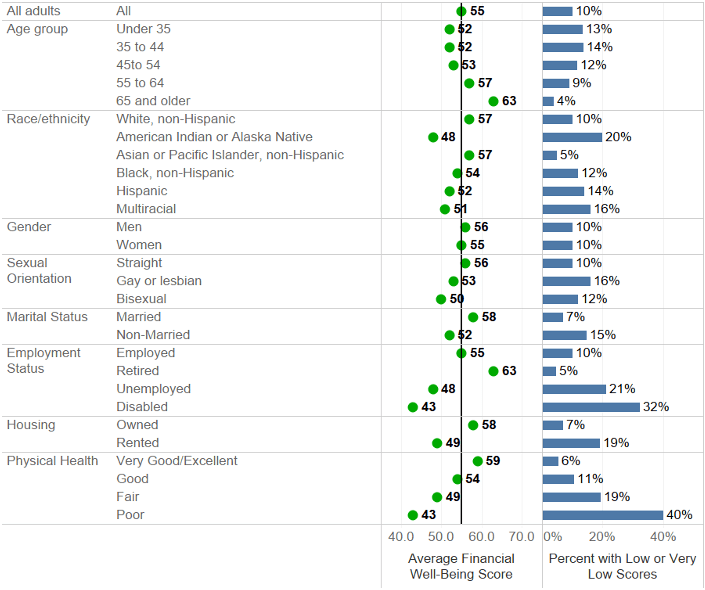
Despite increases in financial well-being between 2017 and 2020, long-standing differences in financial well-being among some groups persisted in 2020.
In 2020, financial well-being varied substantially among some demographic groups. More specifically, males had a higher average financial well-being score than females, married individuals than non-married individuals, homeowners than renters, workers and retirees than individuals who are not working due to unemployment, being laid-off or a disability, and white non-Hispanic respondents than respondents of other racial/ethnic groups. Looking beyond the averages, five groups reported significant shares of their population with low or very low scores: Native Americans, individuals with disabilities, individuals with poor health, individuals with less than a high school education, and respondents whose sexual orientation is gay, lesbian, or bisexual. These groups were twice as likely than the general population to report low or very low levels of financial well-being. These findings support prior CFPB research findings5, that groups with the lowest levels of financial well-being are consistent with individuals who face or have faced lifetime challenges that hinder full participation in the U.S. economy, whether it is due to a disability, health conditions, or discrimination and other biases.
Figure 6: Financial well-being by selected demographic characteristics, 2020
Source: CFPB analysis of the Federal Reserve Board’s Survey of Household Economics and Decision-making. See Methodology for more details.
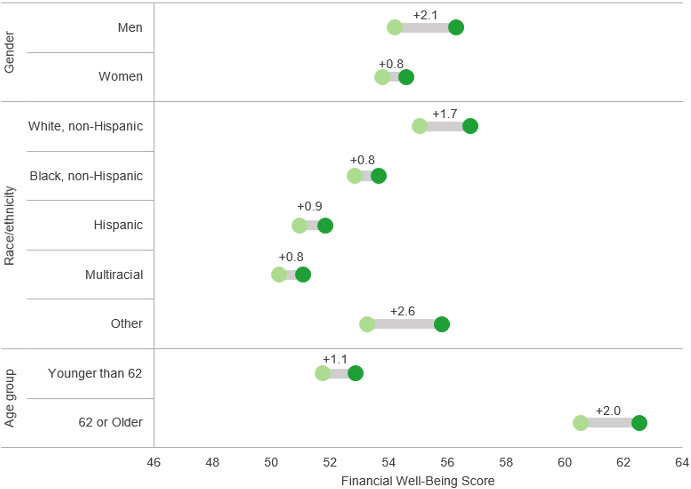
Between 2017 and 2020, U.S. adults of color, younger adults, and women had smaller increases in financial well-being than white adults, older adults, and men.
Differences in financial well-being in 2020 by race, age, and sex are, to some extent, a reflection of the gains in financial well-being that certain groups experienced over the years. The analysis shows that between 2017 and 2020, U.S. adults of color, younger adults, and women had smaller increases in financial well-being than white adults, older adults, and men.
More specifically, financial well-being increased by almost two points between 2017 and 2020 among white adults. However, our analysis did not find a significant change in the average financial well-being of Black, Hispanic, and multiracial adults, which increased by 0.8 or 0.9 points.6
On average, men and women both experienced an increase in financial well-being. However, the increase was larger for men than that of the women. Figure 7 shows that the average score among men increased by over two points from 2017 to 2020. In contrast, the average score among women increased by one point—a small but statistically significant change.7 Finally, the average score among adults aged 62 or older increased by two points, and the average score among adults younger than 62 increased by one point (Figure 7). The changes in scores for the two groups are different and statistically significant.
Socioeconomic disparities such as the racial wealth gap, gender pay inequality, and other barriers likely contribute to the financial well-being score differences we see between groups.
Figure 7: Change in average financial well-being score from 2017 to 2020 by gender, race/ethnicity, and age
Differences in income predict financial well-being, including differences among key racial and ethnic groups.
As expected, financial well-being scores increase, on average, alongside income. The findings show that across all income levels there is a segment of individuals that have low and very low financial well-being scores. Yet, they also show the strong relationship with income. For example, Figure 8 highlights that respondents with household incomes below $40,000 not only reported the lowest levels of financial well-being but also account for 53 percent of the people with low or very low financial well-being in 2020.
Figure 8: Financial well-being by income and education, 2020
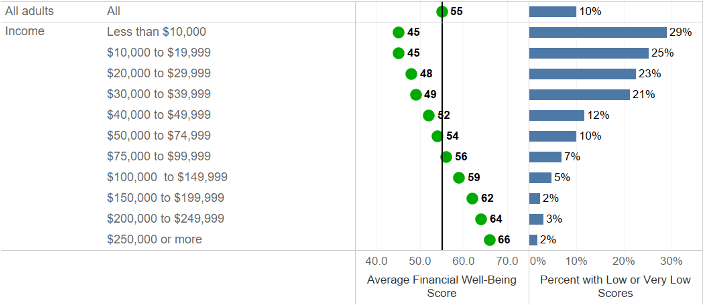
Source: CFPB analysis of the Federal Reserve Board’s Survey of Household Economics and Decision-making. See Methodology for more details.
Income is not only a predictor of financial well-being in a given year, but also appears to predict who enjoys the highest increases in financial well-being. Financial well-being of high-income adults increased more than financial well-being of low-income adults between 2017 and 2020. As Figure 9 shows, financial well-being for consumers with incomes below $50,000 increased by approximately one point between 2017 and 2020, while the average financial well-being score for those with incomes greater than $50,000 increased by between one and two points.
Figure 9: Change in average financial well-being score from 2017 to 2020 by income and education
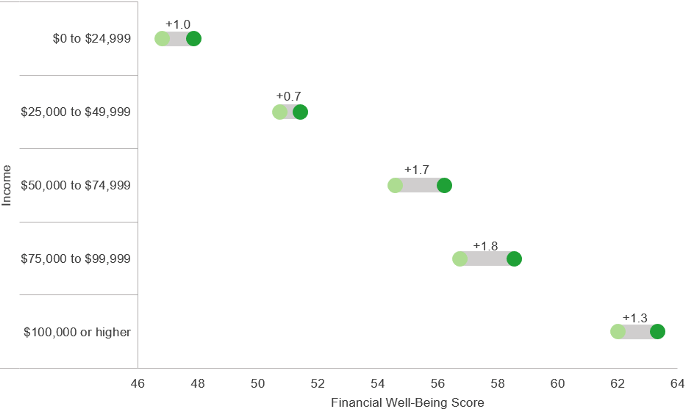
Source: CFPB analysis of the Federal Reserve Board’s Survey of Household Economics and Decision-making. See Methodology for more details. Some college but no degree includes currently enrolled students.
Figure 10 shows that income also appears to explain differences in financial well-being between racial/ethnic groups. When not controlling for income the differences in financial well-being scores by race/ethnicity were all statistically significant. More specifically, compared to white adults, the scores are 3 points lower for Black adults, 5 points lower for Hispanic adults, 6 points lower for respondents of multiple races, and 9 points lower for American Indian or Alaska Native adults. These differences are all statistically significant. However, after controlling for income, the differences were no longer statistically significant.8 Overall, this finding suggests that much of the difference in financial well-being between racial groups is due to income.
Figure 10: Effects of controlling by income in differences in the financial well-being scores between selected racial/ethnic groups and non-Hispanic white adults, 2020
| Comparison | Not Controlling for income | Controlling for income |
|---|---|---|
| Between Black and White, non-Hispanic | -3* | 1 |
| Between Hispanic and White, non-Hispanic | -5* | -1 |
| Between Asian or Pacific Islander and White, non-Hispanic | 0 | -1 |
| Between American Indian or Alaska Native and White, non-Hispanics | -9* | -3 |
| Between Multiracial and White, non-Hispanic | -6* | -2 |
* Denotes that the difference is statistically significant
Source: CFPB analysis of the Federal Reserve Board’s Survey of Household Economics and Decision-making. See Methodology for more details.
These findings indicate that financial well-being scores are a unique and distinctive measure. As such, they provide a tool to identify those who are struggling financially across a variety of groups including individuals who may have high incomes but low levels of financial well-being. At minimum, they suggest that strategies to support adults with low financial well-being need to consider the sufficiency of people’s income and the factors, from fees to high-cost borrowing, that make the lives of low-income individuals costlier than those with higher incomes.
Financial well-being resources
Getting started with measuring financial well-being: This section introduces the CFPB Financial Well-Being Scale with instructions, case studies, and other resources.
Find out your financial well-being: This interactive consumer tool (English | Spanish) allows people to answer the scale 10 questions and see their score. They can compare their score to the national average and by age, income, and employment status, and see selected resources that may be able to help them address money issues that support their own life goals.
Endnotes
-
The categories were developed through a benchmarking process using data from a nationally representative survey of 6,394 adults. Using this data, the CFPB examined the distribution of scores in the United States and developed a set of ranges that best captured similarities in the experiences and circumstances of respondents on such events as credit rejection, material hardship, and the inability to cover an emergency expense, ability to meet regular expenses, and financial product ownership. CFPB, Getting started with measuring financial well-being: A toolkit for financial educators (2019), available at https://files.consumerfinance.gov/f/documents/cfpb_financial-well-being_toolkit.pdf .
↩ -
Individuals with these low and very low financial well-being scores may not necessarily be considered as living in poverty by traditionally measures used in the United States, which is based on the amount of income needed to cover basic needs. People who fall below this amount, also known as the poverty threshold, are considered to live in poverty. Such discrepancy is expected, because financial well-being is conceptually a different and more comprehensive measure than income. Interestingly, 10.1 percent of adults ages 18 to 64 had income below the official poverty line in 2020. U.S. Census Bureau, Table B-5. Poverty Status of People by Age, Race, and Hispanic Origin: 1959 to 2020, at https://www2.census.gov/programs-surveys/demo/tables/p60/273/tableB-5.xls .
↩ -
CFPB, Financial Well-being in America (2017), available at https://files.consumerfinance.gov/f/documents/201709_cfpb_financial-well-being-in-America.pdf .
↩ -
The percent of households reporting a stimulus check may vary from survey to survey due to survey response error. There are also other reasons why people reported not having received a stimulus check, including income eligibility thresholds and being claimed as a dependent on someone’s tax return.
↩ -
CFPB, Financial Well-being in America (2017), available at https://files.consumerfinance.gov/f/documents/201709_cfpb_financial-well-being-in-America.pdf .
↩ -
The 2017 Survey of Household Economics and Decision-making (SHED) survey asked about five races/ethnicities: White, Non-Hispanic; Black, Non-Hispanic; Other, Non-Hispanic; Hispanic; and 2+ races, Non-Hispanic. The 2020 SHED survey gave three additional options – Asian, American Indian or Alaska Native and Asian or Pacific Island – and did not have an “other” option. The survey also asked a separate question about ethnicity (Hispanic or non-Hispanic).
↩ -
When discussing differences between groups, “significant” in this spotlight means “statistically significant,” meaning there is evidence to support that groups or results are different from one another. This was determined by a statistical data analysis. It does not mean “large” or “substantial” when used in this sense.
↩ -
The differences after controlling for income is not statistically significant (asterisks in Figure 9 indicate statistically significant ), meaning we can’t conclude (from this analysis at least) that there is a difference between financial well-being scores for whites adults and other racial groups (i.e., that Black adults would have higher financial well-being than white adults) when controlling for the income differences between the two groups.
↩
Page last modified @