Market monitoring insights: examining the potential credit impact of high vehicle costs for consumers
In our continued monitoring of the auto lending market, we examined available data to explore the potential relationship between rising car prices and changes in auto loan characteristics and performance. This post explores how rising car prices may be leading to larger loan amounts and monthly payments, and how this may be impacting consumers. We are particularly concerned about the impact of these changes on consumers’ financial health, especially for consumers with near-prime or subprime credit scores.
Cars are more expensive than ever, and we see the potential impact in loan structures. Due to supply chain disruptions, including COVID outbreaks at key suppliers, continued chip shortages, and the war in Ukraine, we continue to see constricted supply of new vehicles and increased prices. These constraints on new vehicle production also led to increased demand for used vehicles, rapidly driving up prices.
We note that available data provides an incomplete view of changes in the auto lending market. While the data available to us provides insight into broad indicators, currently available data lacks the granularity to isolate specific economic trends or to fully explore the impact on subsets of consumers. We will continue to seek out data that allows for better visibility into this important market.
The average price consumers paid for new vehicles reached a record high of $48,182 in July of 2022 while the average price of used vehicles is $28,219, just below the record high set in April 2022. As seen in the graph below, prices for vehicles increased over the past two years, especially throughout 2021.
Figure 1: Growth in Average Price of New and Used Vehicles Since July 2020
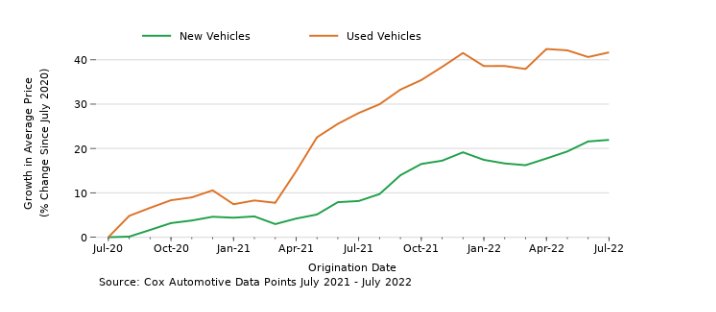
In a recent report and accompanying blog post from the Federal Reserve Bank of New York, researchers found that higher vehicle prices are a significant factor driving larger loan amounts. The dollar value of outstanding auto loans increased by $33 billion between the first and second quarters of 2022 to $1.5 trillion outstanding , an increase they say is due in large part to larger loan originations rather than by an increase in the number of loans . The average new auto loan is roughly $40,000 and the average used auto loan more than $28,000 , which are roughly 15 percent and 35 percent higher than pre-pandemic levels, respectively.
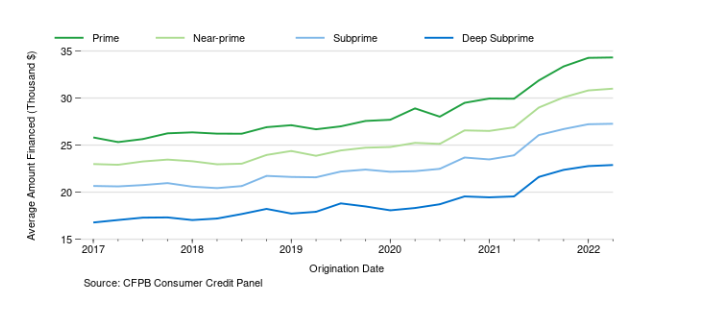
Using data from the CFPB’s Consumer Credit Panel (CCP), a deidentified sample of records from one of the three nationwide consumer reporting agencies, we can see that a jump in the size of newly originated auto loans (Figure 2) coincided with the spike in vehicle prices (Figure 1), and that amount financed has started to plateau along with vehicle price. While we use the CCP to observe market trends for consumers in different credit tiers, we also note that the share of subprime or deep subprime loans may differ from other data sources because some loans are not furnished to credit reporting agencies, as further discussed in section 4.2 of a prior CFPB research report.
Figure 2: Average Amount Financed at Origination by Credit Tier
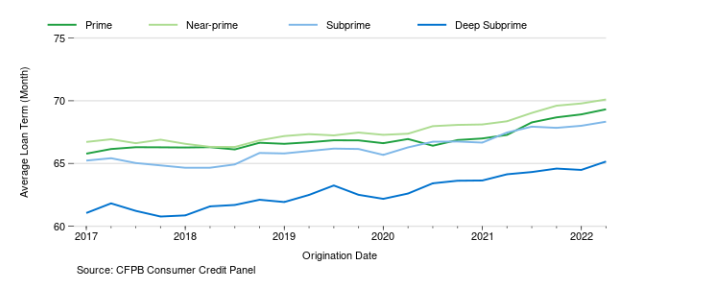
Prior to the pandemic, loan terms were already growing at a steady rate, which has long been a method of reducing consumer’s monthly payments. While loan term lengths continued to increase throughout 2021, the trajectory of that increase is not as steep as that for vehicle prices and loan amounts. We see a gradual increase in loan term lengths as compared to pre-pandemic growth rates (Figure 3). In contrast, vehicle prices (Figure 1) and auto loan amounts (Figure 2) have grown at a much faster rate in recent years compared to pre-pandemic levels.
Figure 3: Average Loan Term Length for Originations by Credit Tier
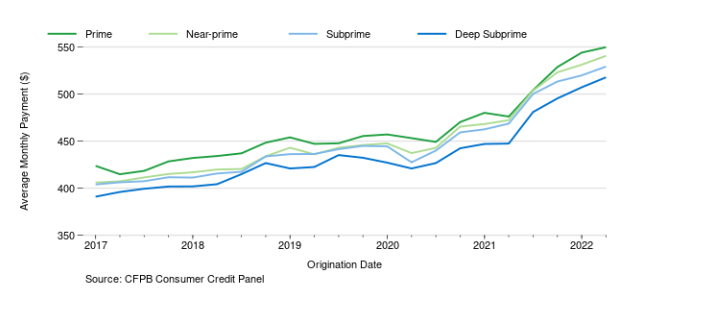
The combination of comparatively gradual loan term length growth, a relatively sharper increase in vehicle prices, and higher interest rates appears to have led to an increase in average monthly payments across all credit tiers of between 13 and 19 percent year-over-year (Figure 4).
Figure 4: Average Monthly Payment at Origination by Credit Tier
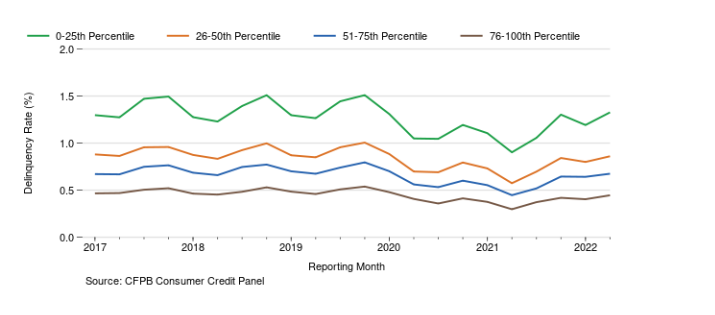
Recent data show that the rate of transition into delinquency, especially for low-income borrowers, has risen over the past year. This rise could simply be a return to pre-pandemic levels resulting from the end of pandemic-related stimulus policies. However, inflationary pressures could mean the costs of car ownership are outpacing income growth for some consumers with auto loans. While we cannot fully infer the contribution of either of these possible explanations to the rise in delinquency rates, we cannot ignore the relationship between larger loan amounts and increasing interest rates to consumer’s monthly budgets and some consumers’ struggle to stay current on their loans.
Figure 5: Auto Loan Delinquencies (Accounts 60 Days Past Due) by Consumer Census Tract Income Quartile
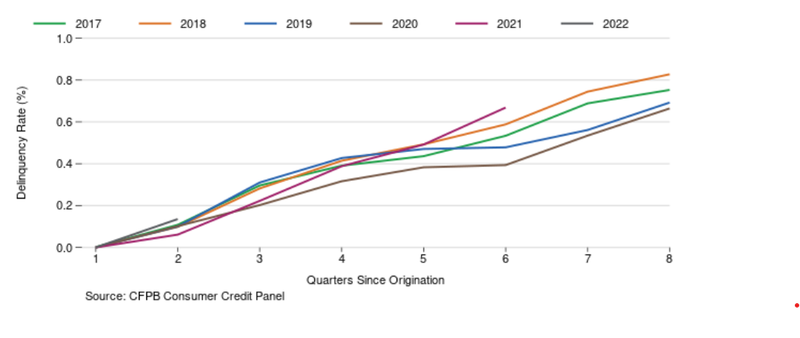
When looking at delinquency in the first two years after purchase, loans originated in 2021 and 2022 are starting to show higher delinquency rates relative to loans originated in previous years, even when compared to loans unaffected by pandemic-related stimulus payments. For example, auto loans originated in 2021 have a delinquency rate of 0.67 percent in the sixth quarter after origination, which is 13 percent higher than the delinquency rate of auto loans originated in 2018.
Figure 6: Delinquency Rate in First 8 Quarters After Origination by Vintage
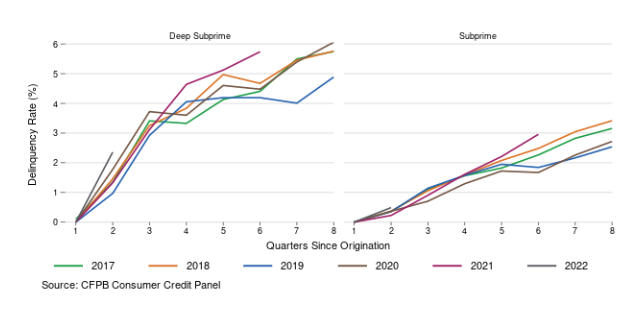
This trend is even more pronounced for consumers with subprime and deep subprime credit scores. For example, 2022 vintage auto loans for consumers with deep subprime credit scores were 2.4 percent delinquent two quarters after origination, which is a 33 percent increase from the previous five-year high set in 2020.
Figure 7: Delinquency Rate in First 8 Quarters After Origination by Vintage for Deep Subprime and Subprime Consumers
The auto lending market has changed rapidly, and the potential implications for consumers may be significant. As we outlined in an earlier blog post, we are focused on ensuring a fair, transparent, and competitive auto lending market by ensuring affordable credit for auto loans, monitoring practices in auto loan servicing and collections, and fostering competition among subprime lenders.
Links or citations in this post do not constitute an endorsement by the Bureau.