Profiles of older adults living in mobile homes
By the CFPB Office for Older Americans – MAY 10, 2022
Contact the Office for Older Americans: olderamericans@cfpb.gov
In February 2022, approximately 3.2 million adults ages 60 and older lived in mobile homes, according to the Census Bureau’s Household Pulse Survey.1 Using data from the Pulse Survey, this spotlight examines the characteristics and experiences of older adults living in mobile homes. The spotlight shows that a vast majority of older adults living in mobile homes own their homes outright, without any mortgage debt. Yet despite this fact, many older adults living in mobile homes are equally burdened by housing costs as compared to their counterparts living in other housing settings and frequently struggle to afford regular living expenses.
Older adults living in mobile homes tend to be women and persons living outside the 14 largest metropolitan areas
In general, older adults living in mobile homes and those living in other housing settings share similar demographic characteristics. However, there are two notable differences. First, older adults living in mobile homes report generally having lower incomes and levels of formal education than their counterparts.4 Second, 86.4 percent of older adults in mobile homes live outside of the 14 largest metropolitan statistical areas compared to 69.7 percent of older adults living in other housing settings.5
Figure 2: Demographic characteristics of older adults living in mobile homes and older adults living in other housing settings, February 2022
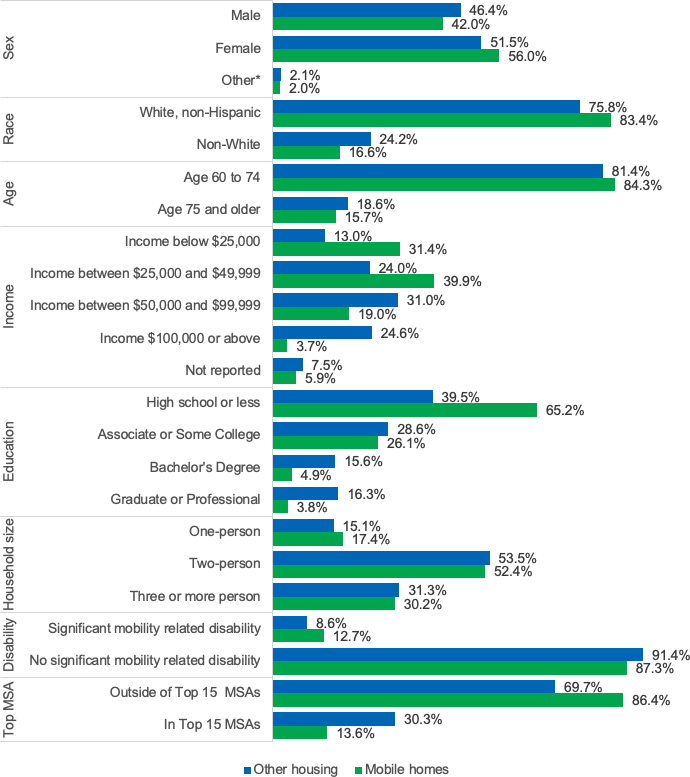
Source: CFPB’s estimates using data from the Census Bureau’s Household Pulse Survey Use Files (Wave 42). See “About the Census Household Pulse Survey” section for more details on the data and methodology. Note: Other housing includes: one-family house (attached or detached to other house); a building with 2 or more apartments; and boat, RV, or van.
Most older adults living in mobile homes own their homes without any mortgage6, but are equally burdened by housing costs as compared to older adults residing in other housing settings
In general, older adults living in mobile homes are more likely to own their home than their counterparts living in other settings. Similarly, older adults living in mobile homes are more likely to own their home than the younger adult population (ages 18 to 59 years old) living in mobile homes. Compared to both their counterparts living in other housing settings, as well as younger homeowners living mobile homes, older adults who live in mobile homes are also more likely to own the property outright without any mortgage debt.7
Figure 3: Homeownership and renting status by age group and housing type, February 2022
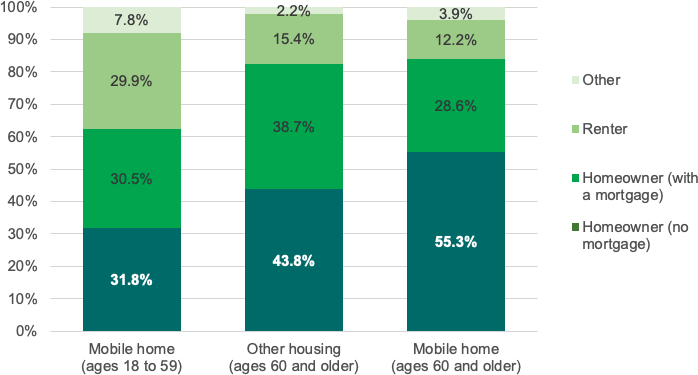
Source: CFPB’s estimates using data from the Census Bureau’s Household Pulse Survey Use Files (Wave 42). See “About the Census Household Pulse Survey” section for more details on the data and methodology. Note: “Other housing” includes: one-family house (attached or detached to other house); a building with 2 or more apartments; and boat, RV, or van. The “other category” refers to older adults living in other arrangements such as rent-free with family members.
Mobile homes are generally viewed as a more affordable housing option for renters and homeowners alike. Yet, the Census Bureau’s American Community Survey shows that older adults living in mobile homes are as housing-cost burdened as their peers living in other forms of housing.8 More specifically, older adults living in mobile homes pay a lower total amount on housing, but pay a similar share of their income for housing-related cost as older adults living in other housing settings.9 Likewise, older adults renting mobile homes pay a similar share of their income to housing costs as renters residing in other forms of housing.
Housing burden of older adults by housing setting and renter/homeowner status, 2019
| Data point | Homeowner: Mobile Home | Homeowner: Other Housing | Renter: Mobile Home | Renter: Other Housing |
|---|---|---|---|---|
Average percent of income spent on housing |
24.0% |
23.0% |
40.0% |
42.0% |
Percent spending 30 percent or more on housing costs |
25.3% |
23.1% |
55.7% |
57.3% |
Percent spending 50 percent or more on housing costs |
11.3% |
10.3% |
28.5% |
30.2% |
Average dollar monthly housing costs |
$582 |
$1,113 |
$751 |
$1,052 |
Source: CFPB’s estimates using data from the Census Bureau 2019 American Community Survey. The analysis was conducted online using the Census’ custom table functionality at https://data.census.gov/mdat/#/
Many older adults living in mobile homes struggle to afford their regular living expenses
Between August 2021 and February 2022, older adults living in mobile homes experienced financial hardships more frequently than their counterparts living in other housing settings. This is true even when accounting for income. Approximately 12 percent of older adults living in mobile homes reported that it was “very difficult” to pay for their usual household expenses.10 Others (25.1 percent) reported that they “sometimes or often” did not have enough food to eat or could not afford additional groceries. Almost a quarter (22.1 percent) reported that in the past 12 months they were unable to make a full or partial payment on at least one energy bill and more than a quarter (26.3 percent) said that they kept their homes at an unsafe or unhealthy temperature at least one month per year.
Experience of selected hardships by housing type and age group, August 2021 to February 2022
| Hardship | All Incomes: Mobile Homes | All Incomes: Other Housing | Income below $25,000: Mobile Homes | Income below $25,000: Other Housing |
|---|---|---|---|---|
Difficulty Covering Expenses |
11.9% |
6.2% |
22.3% |
19.4% |
Not Enough Food to Eat & Unable to Buy More |
25.1% |
11.3% |
40.7% |
29.9% |
Unable to Pay Energy Bills |
22.1% |
10.2% |
34.0% |
26.5% |
Kept Home at Unsafe Temperature |
26.3% |
14.3% |
37.1% |
30.1% |
Source: CFPB’s estimates using data from the Census Bureau’s Household Pulse Survey Use Files, Pooled Sample (Waves 36-42). See “About the Census Household Pulse Survey” section for more details on the data and methodology. Note: Other housing includes: one-family house (attached or detached to other house); a building with 2 or more apartments; and boat, RV, or van.
Older adults living in mobile homes face greater housing insecurity than their peers living in other housing settings.
Between August 2021 and January 2022, 7.9 percent of older adults who owned their mobile homes with a mortgage were behind on their payments and 1.9 percent reported that they were likely facing foreclosure. In contrast, 1.9 percent of older adults who owned other types of homes with a mortgage were behind on their payments and less than 1 percent reported that they were likely facing foreclosure. During this same period, 15.7 percent of older adults renting mobile homes reported being behind on rent payments and 6.5 faced eviction. In comparison, 10.9 percent of older adults renting other types of homes reported being behind on rent payments and 3.6 percent faced eviction.
Figure 4: Percent of older adults living in mobile homes late in their mortgage and rent payments, August 2021 to February 2022
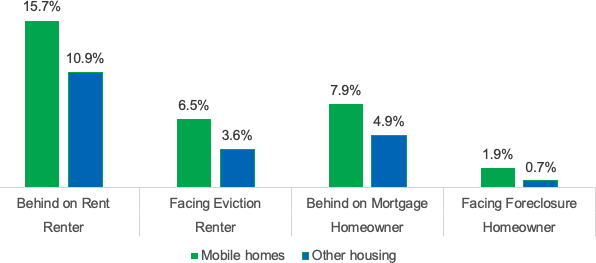
Source: CFPB’s estimates using data from the Census Bureau’s Household Pulse Survey Use Files, Pooled Sample (Waves 36-42). See “About the Census Household Pulse Survey” section for more details on the data and methodology. Note: Other housing includes: one-family house (attached or detached to other house); a building with 2 or more apartments; and boat, RV, or van.
These differences persist even when we compare the rates among older adults with incomes below $25,000. Specifically, 16.6 percent of older adults with incomes below $25,000 who owned their mobile homes with a mortgage were behind on their payments and 7.8 percent reported that they were likely facing foreclosure. In contrast, 12.4 percent of older adults with incomes below $25,000 who owned other types of homes with a mortgage were behind on their payments and 3.2 percent reported that they were likely facing foreclosure. Among older adults renting a mobile home, 20.3 percent with incomes below $25,000 reported being behind on rent and 9.9 faced eviction. In comparison, 14.1 percent older adults with incomes below $25,000 renting other types of homes reported being behind on rent payments and 5.1 percent faced eviction.
Older adults living in mobile homes experienced higher rates of economic and health impacts during the COVID-19 pandemic than their counterparts living in other settings
Older adults in mobile homes were more likely to report being diagnosed with COVID than older adults living in other housing settings. Similarly, older adults in mobile homes were more likely to report a loss of employment income over a four-week period than older adults living in other housing settings.11 However, the share of older adults reporting these experiences is similar when the analysis is restricted to those with incomes below $25,000.
Figure 5: Percent of older adults impacted by job loss and COVID-19 by housing setting, August 2021 to February 2022
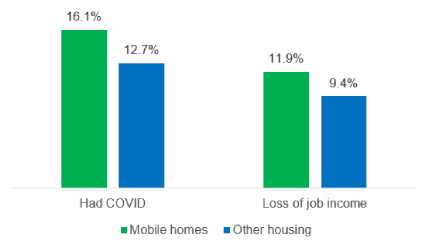
Source: CFPB’s estimates using data from the Census Bureau’s Household Pulse Survey Use Files, Pooled Sample (Waves 36-42). See “About the Census Household Pulse Survey” section for more details on the data and methodology. Note: Other housing includes: one-family house (attached or detached to other house); a building with 2 or more apartments; and boat, RV, or van.
Information for older adults living in mobile homes
If you’re having trouble making rent or mortgage payments because of the coronavirus pandemic, you’re not alone. Federal, state, and local governments are offering help with housing expenses and avoiding eviction. You can find more information about help for homeowners at: consumerfinance.gov/housing
Endnotes
- The Pulse Survey does not define the term “mobile home.” Because the Pulse Survey provides answer options to questions on housing that include a “mobile home” and “a boat, RV, van, etc.,” the CFPB believes that respondents likely interpreted the term “mobile home” to mean manufactured homes. Manufactured homes are factory-built housing that are at least 320 square feet, built on permanent chassis, and constructed after June 15, 1976 in accordance with the U.S. Department of Housing and Urban Development’s Manufactured Home Construction and Safter Standards code. For further discussion of the use of terms “mobile home” versus “manufactured home”, see the “About the Census Household Pulse Survey” at the end of the Spotlight. See also, Consumer Financial Protection Bureau, Manufactured Housing Finance: New Insights from the Home Mortgage Disclosure Act Data (May 2021) page 7.
- The Pulse Survey, Wave 42 (which spans from January 26, 2022 to February 7, 2022) estimates that there are 72.8 million adults ages 60 and older living in all types of housing settings. Based on this estimate, 4.2 percent of older adults live in mobile homes. Readers should note, however, that 14.7 percent of older adults (an estimated 10.7 million adults ages 60 and older) did not provide an answer or response to the housing type question in the Pulse Survey. This group is excluded from the CFPB’s analysis.
- The CFPB cannot provide an analysis of all age groups because the Pulse Survey does not provide a count for people under the age of 18. However, the U.S. Census Bureau American Community Survey (ACS) does. The ACS is an annual survey of the over 3.5 million households that provides detailed information on the characteristics of people and households. The ACS Survey shows that in 2019 older adults ages 60 and older account for 22.9 percent of the population, yet they account for 23.8 percent of the people living in mobile homes. This analysis was conducted online using the Census’ custom table functionality at https://data.census.gov/mdat/#/ . For more information on the ACS survey go to, https://www.census.gov/programs-surveys/acs/about.html
- The patterns described in this section regarding income and education align with the findings of the 2014 CFPB report Manufactured-housing consumer finance in the United States for residents of mobile homes of all ages. See https://files.consumerfinance.gov/f/201409_cfpb_report_manufactured-housing.pdf .
- The 14 largest metropolitan statistical (“MSA”) areas are (1) New York-Newark-Jersey City, NY-NJ-PA Metro Area; (2) Los Angeles-Long Beach-Anaheim, CA Metro Area; (3) Chicago-Naperville-Elgin, IL-IN-WI Metro Area; (4) Dallas-Fort Worth-Arlington, TX Metro Area; (5) Houston-The Woodlands-Sugar Land, TX Metro Area; (6) Washington-Arlington-Alexandria, DC-VA-MD-WV Metro Area; (7) Miami-Fort Lauderdale-Pompano Beach, FL Metro Area; (8) Philadelphia-Camden-Wilmington, PA-NJ-DE-MD Metro Area; (9) Atlanta-Sandy Springs-Alpharetta, GA Metro Area; (10) Phoenix-Mesa-Chandler, AZ Metro Area; (11) Boston-Cambridge-Newton, MA-NH Metro Area; (12) San Francisco-Oakland-Berkeley, CA Metro Area; Riverside-San Bernardino-Ontario, CA Metro Area; (13) Detroit-Warren-Dearborn, MI Metro Area; (14) Seattle-Tacoma-Bellevue, WA Metro Area. For more information on how these areas are defined, see: https://www.bls.gov/sae/additional-resources/metropolitan-and-necta-divisions-published-by-ces.htm
- The Pulse Survey asks consumers, “Is your house or apartment…? Select only one answer. (1) Owned by you or someone in this household free and clear? (2) Owned by you or someone in this household with a mortgage or loan (including home equity loans)? (3) Rented? (4) Occupied without payment of rent?” Accordingly, the CFPB’s reference to mobile homeowners not having a mortgage includes other loans encumbering ownership such as chattel loans (now commonly referred to as “home-only loans”) and home equity loans.
- While mobile home owners may not have a mortgage, they nevertheless may still need to pay ground rent for the land on which the mobile home is placed and other community fees the mobile home park may charge. In this Data Spotlight, older adults who own their mobile homes, but pay ground rents are still described as “mobile home owners” in this report. In contrast, those older adults who this report describes as “renters” are persons who pay rent to live in the mobile home and does not include those who are solely paying ground rents.
- See The U.S. Census Bureau American Community Survey at, https://www.census.gov/programs-surveys/acs/about.html .
- The ACS asks about the cost of utilities, condominium fees, taxes, insurance, mortgages, and home loans to determine owners’ housing costs. For mobile home owners, the ACS separately asks about licenses and registration fees, property taxes, and site rent. For more information on how the American Community Survey gathers information on housing costs for owners, see https://www.census.gov/acs/www/about/why-we-ask-each-question/housing/ .
- The survey asked: “In the last 7 days, how difficult has it been for your household to pay for usual household expenses, including but not limited to food, rent or mortgage, car payments, medical expenses, student loans, and so on?”
- For example, 18.0 percent of older adults in mobile homes with incomes below $25,000 reported a loss of employment income over a four-week period compared to 16.3 percent of their counterparts living in other housing settings. Likewise,13.4 percent of older adults with incomes below $25,000 living in mobile homes reported being diagnosed with COVID-19 compared to 13.8 percent of their counterparts living in other housing.
- The American Housing Survey (AHS) is a biennial longitudinal survey of housing units sponsored by the Department of Housing and Urban Development (HUD) and conducted by the U.S. Census Bureau. The survey provides information about the conditions, quality, and cost of housing in the United States and major metropolitan areas, and the characteristics of people who live in these homes. More information about the AHS can be found at: https://www.census.gov/programs-surveys/ahs/about.html .
- Data on the number of mobile home units in 2019 based on the American Housing Survey can be found at: https://www.census.gov/programs-surveys/ahs/data/interactive/ahstablecreator.html?s_areas=00000&s_year=2019&s_tablename=TABLE1&s_bygroup1=15&s_bygroup2=1&s_filtergroup1=1&s_filtergroup2=1
Page last modified @