Trends in reverse mortgage direct mail advertising
By the CFPB Office for Older Americans – AUG 09, 2023
Contact the Office for Older Americans: olderamericans@cfpb.gov
Many older adults value homeownership, with nearly 80 percent owning their home,1 and nine out of ten wanting to remain in their homes for as long as possible. Home equity is often an older adult’s largest asset2, and one that has grown in recent years as home prices soared across the United States.3 The older adult population by 2060 will comprise nearly a quarter of the U.S. population,4 and for many of these older adults, home equity will act as a safety net to help cover retirement shortfalls, increasing healthcare expenditures, and the substantial cost of long-term supports and services5 needed to age in place.6
Introduction
A reverse mortgage is a product that allows homeowners age of 62 or older to turn their equity into cash or a line of credit while not requiring them to make monthly mortgage payments. The most common type of reverse mortgage is the Home Equity Conversion Mortgage (HECM), a loan insured by the Federal Housing Administration, part of the U.S. Department of Housing and Urban Development. This loan was designed to assist lower income homeowners by “reducing the effect of…economic hardship” by allowing homeowners to access their equity to meet more immediate needs.7 With a reverse mortgage, the borrower owes the money borrowed as well as compounding interest and fees. Unlike traditional mortgage loans, the amount the borrower owes will grow and usually their equity (and accordingly their overall wealth) will decline over time. Typically, a reverse mortgage is a more expensive product than other home loans. For some older adult homeowners, using their equity to avoid monthly mortgage payments is a tradeoff they are willing to accept. For others, it’s a product that jeopardizes their financial security and may prevent them from leaving their home to their heirs.
Since its inception, the Consumer Financial Protection Bureau (CFPB) has monitored the reverse mortgage market, because these products can be expensive and risky for older adults. This focus is consistent with the CFPB’s statutory mandate to help older consumers make sound financial decisions as they age; monitor for risks to consumers in the offering or provision of consumer financial products or services; and help older adults protect themselves from unfair, deceptive, or abusive practices. To assess market trends, the CFPB analyzed reverse mortgage direct mail advertising volume from 2016 through 2022. Advertisements are often an older adult’s entry point to the product and can provide key details about the loan. Analyzing ad content may reveal deficient or otherwise problematic disclosures, while looking at ad volume can show the targeting of certain populations and provide insights into emerging new products and markets.8
While looking at ad volume, the CFPB observed the following:
- Reverse mortgage direct mail advertising volume increased significantly in 2021 and 2022 compared to the prior five years.
- Reverse mortgage direct mail advertising largely went to low- and middle-income households.
- Most reverse mortgage direct mail advertising went to consumers living in the South and West regions where reverse mortgage lending is concentrated and where a somewhat higher share of older homeowners report difficulty making ends meet and difficulty making mortgage payments.
- A greater share of direct mail ads for reverse mortgages in 2021 and 2022 mentioned refinancing compared to previous years.
The findings suggest that reverse mortgage advertising during the COVID-19 pandemic, when home prices surged and interest rates fell, focused on many older homeowners with high equity, lower incomes, and in regions where homeowners have somewhat less ability to stay current on their housing payments.
Reverse mortgage direct mail advertising volume increased significantly in 2021 and 2022 compared to the prior five years
In 2021, consumers received an estimated 44 million direct mail advertisements about reverse mortgages, and 48 million ads in 2022. This estimated ad volume is about four times higher than 2019 and 2020, when the volume was approximately 11 million each year. A small number of companies are responsible for most of the ad volume, with one company accounting for approximately two-thirds (66 percent) of estimated direct mail reverse mortgage advertising volume between 2016-2022.9
FIGURE 1: Estimated direct mail advertising volume of reverse mortgages and reverse mortgage endorsements10, 2016-2022
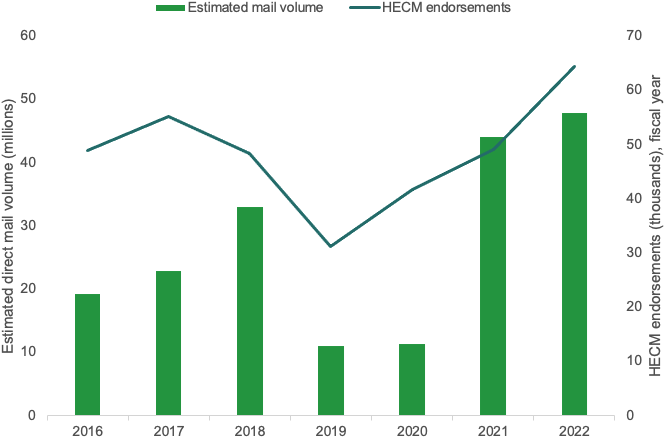
Source: CFPB analysis of data provided by Competiscan and Federal Housing Administration, “Annual Report to Congress Regarding the Financial Status of the Federal Housing Administration Mutual Mortgage Insurance Fund,” Table D-22.
These increases in ad volume mirrored similar increases in HECM endorsements and refinances. Data from the Federal Housing Administration (FHA) show HECM loans endorsed by FHA increased in fiscal year 2022 to the highest level since fiscal year 2011.11 As discussed later in this report, refinancing reverse mortgages has contributed to that increased volume, making up about half of reverse mortgage loans endorsed in 2021 and 2022.12
Reverse mortgage direct mail advertising largely went to low- and middle-income households
Nearly three-quarters (74 percent) of reverse mortgage direct mail advertising volume went to consumers with low and moderate incomes (household income below $75,000) in 2021-2022.13 This suggests direct mail advertising disproportionally targets low and moderate-income households, since only 53 percent of households headed by an older homeowner have incomes below $75,000.14
FIGURE 2: Estimated direct mail volume for reverse mortgages and older homeowners by household income
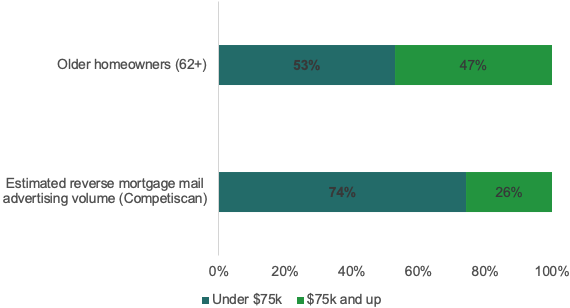
Source: CFPB analysis of data provided by Competiscan for estimated direct mail volume, 2021-2022. CFPB analysis of US Census Bureau American Community Survey data, 2021 (share of homeowners, based on housing tenure, ages 62 and above).
Most reverse mortgage direct mail advertising went to consumers living in South and West regions where reverse mortgage lending is concentrated
In 2021 and 2022, reverse mortgage direct mail advertising largely has gone to states in the South and West Census regions . Approximately 84 percent of direct mail reverse mortgage ads went to consumers living in states in the South and West during this period. This is a larger share than the portion of older homeowners living in those regions.15 The share of direct mail reverse mortgage ads to consumers was similar to the share of HECM loans endorsed in the South and West region during this period (87 percent).16 There were some differences between the West and South, however, with both advertising and endorsements far more concentrated in the West compared to the share of older homeowners in that region.
FIGURE 3: Estimated direct mail reverse mortgage advertising volume, reverse mortgage endorsements, and older homeowners by U.S. Census region
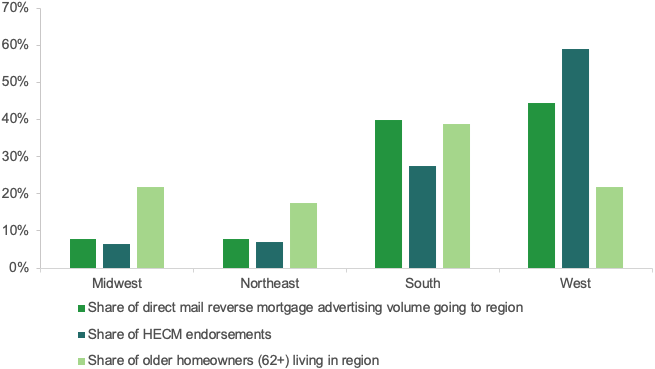
Source: CFPB analysis of data provided by Competiscan, 2021-2022 data, and U.S. Census Bureau’s American Community Survey, 2021 data. Homeowners are defined in Census data by tenure, and this analysis includes homeowners ages 62 and up.
In looking at reverse mortgage endorsements, the West and South also have a significantly higher number of reverse mortgage lenders and a higher proportion of reverse mortgages refinances. This is true especially in the West, where more than half (51 percent) of reverse mortgages were for refinancing from 2021-2022.
Older homeowners in both the South and West display some unique characteristics that raise potential concerns about the financial circumstances of borrowers there. In both regions, a somewhat larger share of older homeowners report difficulty covering regular expenses. Additionally, a slightly larger share of older adults appears to be behind on their mortgages than older adults in the Midwest and Northeast. In the South region, older homeowners are more likely to have credit card and medical debt than older adults in the Northeast and Midwest regions. In the West region, older homeowners are more likely to own their homes with an outstanding mortgage than older homeowners in other regions.
There are also noteworthy differences in the racial/ethnic profile of older homeowners in these regions. Specifically, the South and West regions have a higher share of non-white older homeowners than Northeast and Midwest regions, with a high share of Black older homeowners in the South and a high share of Hispanic older homeowners in the West.
TABLE 1: Selected characteristics of reverse mortgages and older homeowners by U.S. Census region
| Category | Source | Measure | Northeast | Midwest | South | West |
|---|---|---|---|---|---|---|
| Reverse Mortgages | (a) | Number of endorsements |
7,772 | 7,223 | 30,831 | 65,880 |
| | (a) | Share of endorsements |
7% | 6% | 28% | 59% |
| | (a) | Percent Refinance |
25% | 20% | 32% | 51% |
| | (a) | Percent Traditional |
73% | 73% | 63% | 45% |
| | (a) | Percent HECM for Purchase |
2% | 7% | 5% | 3% |
| | (a) | Number of originators |
374 | 245 | 916 | 2,314 |
| Older homeowners | (b) | Percent non-White |
14% | 11% | 24% | 26% |
| | (b) | Percent Black |
6% | 6% | 13% | 3% |
| | (b) | Percent Hispanic |
4% | 2% | 7% | 12% |
| | (b) | Percent with a mortgage |
40% | 39% | 38% | 48% |
| | (c) | Percent with credit card debt17 |
28% | 25% | 31% | 22% |
| | (c) | Percent with medical debt18 |
7% | 7% | 9% | 4% |
| | (d) | Percent reporting difficulty covering regular expenses19 |
12% | 10% | 16% | 13% |
| | (d) | Percent reporting being behind on their mortgage20 |
4% | 3% | 6% | 5% |
Source: CFPB analysis of (a) HUD’s FHA HECM Single Family Portfolio Snapshot (2021-2022), https://www.hud.gov/program_offices/housing/rmra/oe/rpts/hecmsfsnap/hecmsfsnap (b) Census Bureau’s American Community Survey 5-year sample, (2017-2021), accessed through Census MDAT https://data.census.gov/mdat/#/search?ds=ACSPUMS5Y2021 (c) FINRA Foundation 2021 National Financial Capability Study (2021), which can be found at https://www.finrafoundation.org/knowledge-we-gain-share/nfcs/using-the-data , and (d) Census Bureau’s Household Pulse Survey (June/July 2021, Wave 33), which can be found at https://www.census.gov/programs-surveys/household-pulse-survey/datasets.html#phase3.3 .
A greater share of direct mail ads for reverse mortgages in 2021 and 2022 mentioned refinancing compared to previous years
Since 2016 the percentage of reverse mortgage direct mail referencing refinancing has grown.21 These ads generally encouraged homeowners with existing reverse mortgage loans to refinance into new reverse mortgages. Over the 2016-2022 period, an estimated 10 percent of estimated direct mail reverse mortgage advertising referenced refinancing,22 with 87 percent of this volume occurring in 2021-2022.
The increase in reverse mortgage refinancing ad volume is consistent with trends showing that the number of reverse mortgage refinance loans increased significantly in 2021 and 2022 compared to 2020.23 Increasing home values, which allow homeowners to extract more equity, along with low interest rates in 2021 and early 2022, likely contributed to the increased number of borrowers refinancing their reverse mortgage loan.
FIGURE 4: Share of HECM loan endorsements by loan type and month
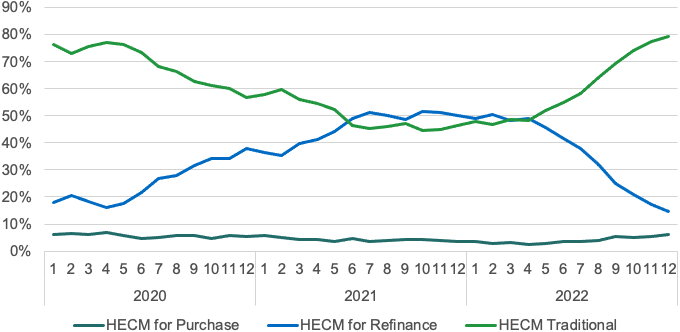
Source: CFPB analysis of HUD’s FHA HECM Single Family Portfolio Snapshot (2020-2022). Note: HECM For Purchase is a loan that allows people 62 and older to purchase a new principal residence with HECM loan proceeds. HECM for Refinance loans allow consumers with existing HECM loans to refinance into new HECM loans.
Indeed, the text of many ads presented reverse mortgage refinancing as a way to leverage increased home values. For example, one ad from early 2022 stated, “With such strong home values and continued low interest rates, refinancing your current reverse mortgage loan can be a smart financial decision.” Another ad urged consumers to “take advantage of your soaring home values.” A third ad referenced the impact of inflation, stating, “Fluctuating market conditions and record high inflation don't have to take away from the retirement lifestyle you deserve.”
Conclusion
The CFPB’s findings reflect that recent reverse mortgage advertising, which experienced a four-fold increase since 2019, largely focused on older homeowners with high equity and lower incomes and those residing in regions where homeowners have somewhat less ability to stay current on their housing payments. Although the intent of the HECM program is to meet the needs of older adult homeowners with lower incomes the data nevertheless suggests that reverse mortgage lenders are potentially targeting vulnerable populations with an expensive product that may not be best suited for their individual housing and financial needs. Moreover, the increase in ads for reverse mortgage refinances are concerning in that they suggest lenders may be targeting existing reverse mortgage borrowers for costly closing costs rather than providing them with a new product that reduces the effect of economic hardship.
The CFPB encourages the mortgage market to ensure alternative mortgage products, like refinances and home equity lines of credit, are readily available to older adult homeowners. We are committed to working with state regulators to ensure fairness in advertising and to help consumers know where to go for help, whether that’s filing a complaint with state enforcement agencies or with the CFPB. Additionally, our findings confirm the continuous need to provide unbiased information to older adult homeowners about how reverse mortgages work and what options older homeowners may use to harness their home equity. These findings will inform our ongoing monitoring of the reverse mortgage marketplace, where we identify risks to older adults and take steps to ensure they are protected from potentially unlawful practices.
Footnotes
- U.S. Census Bureau, Housing Vacancies and Homeownership, Table 7, Homeownership Rates by Age of Householder, https://www.census.gov/housing/hvs/data/detailed_tables.html . This table shows homeownership rates of 78.9 percent among householders ages 65 and up in the second quarter of 2023.
- For example, in 2019, home equity accounted for 19 percent of all the assets held by homeowners age 62 and older, and the total value of housing wealth for the population age 62 and older was about $9 trillion. Older homeowners had a primary residence with a median value of $205,000, a median of $160,000 in home equity, and a median of $84,500 for all financial assets combined (including deposits in liquid accounts such as savings accounts, retirement accounts, and investments such as stocks and bonds). CFPB analysis of the Federal Reserve Board, Survey of Consumer Finances 2019.
- For example, according to Census data, the median home value for households headed by an adult aged 65 and up rose from $254,000 in 2019 to $287,000 in 2021, an increase of $33,000 or 13 percent. CFPB analysis of Census Bureau American Community Survey data.
- The U.S. Census Bureau predicts that by 2060, nearly a quarter of the U.S. population (94.7 million people) will be at least 65 years old. The number of adults ages 65 and older is expected to grow from approximately 49.2 million in 2016 to approximately 94.7 million in 2060. This represents an approximately 92 percent increase in the older adult population. By comparison, the population under age 65 is projected to grow by only about 13 percent during this time. U.S. Census Bureau, 2017 National Population Projections: Table 2: Projected age and sex composition of the population (2017), https://www.census.gov/data/tables/2017/demo/popproj/2017-summary-tables.html .
- For example, one study showed that on average a person turning 65 will incur over $120,000 in future costs of long-term services and supports (in today’s dollars) and families will need to pay more than one-third out of pocket. U.S. Dep’t of Health & Human Services, Office of the Assistant Secretary for Planning and Evaluation (ASPE), Long-Term Services and Supports for Older Americans: Risks and Financing, 2022, (Aug. 2022), https://aspe.hhs.gov/sites/default/files/documents/8f976f28f7d0dae32d98c7fff8f057f3/ltss-risks-financing-2022.pdf .
- Many older adults also may have inadequate income and savings to cover costs in retirement. For example, one study projects that over 40 percent of households where the head of the household is aged 35-64 will have a shortfall during retirement (with a nearly a four trillion-dollar income deficit). Jack VanDerhei, What Causes EBRI Retirement Readiness Ratings to Vary: Results from the 2019 Retirement Security Projection Model, EBRI Issue Brief (Mar. 2019), available at https://www.ebri.org/retirement/retirement-security-projection-model/content/retirement-savings-shortfalls-evidence-from-ebri-s-2019-retirement-security-projection-model .
- Housing and Community Development Act of 1987 (PUBLIC LAW 100-242, Section 417) at https://www.congress.gov/100/statute/STATUTE-101/STATUTE-101-Pg1815.pdf . In 2022, HECM loans comprised over 85 percent of the market and although the Competiscan ad data the CFPB analyzed for this report does not distinguish the type of reverse mortgage loan, the CFPB’s discussion references HECM loans. For example, in the case of HECM loans, although the borrower does not need to make monthly mortgage payments, the homeowner still has ongoing obligations including living in the home as their principal residence, keeping the home in good repair, and paying their property taxes and homeowners insurance on time.
- In the past, the CFPB has found that older homeowners may be confused by less than accurate advertising about reverse mortgages. Specifically, in 2015, the CFPB published a report that found that consumers were left with false impressions of reverse mortgages after viewing advertisements. See “CFPB Study Finds Reverse Mortgage Advertisements Can Create False Impressions,” June 4, 2015 at https://www.consumerfinance.gov/about-us/newsroom/cfpb-study-finds-reverse-mortgage-advertisements-can-create-false-impressions/. In 2021, the CFPB sued a reverse mortgage provider for deceptive marketing. See “CFPB Takes Action Against American Advisors Group for Deceptively Marketing Reverse Mortgages to Consumers,” October 8, 2021, https://www.consumerfinance.gov/about-us/newsroom/cfpb-takes-action-against-american-advisors-group-for-deceptively-marketing-reverse-mortgages-to-consumers/.
- The reverse mortgage market is concentrated among a handful of lenders. In 2021 the top ten reverse mortgage lenders accounted for about 93 percent of all reverse mortgage originations. Consumer Financial Protection Bureau, “Data Point: 2021 Mortgage Market Activity and Trends,” https://files.consumerfinance.gov/f/documents/cfpb_data-point-mortgage-market-activity-trends_report_2022-09.pdf .
- This graphic shows endorsements of HECM loans, the most common type of reverse mortgage loan. The term endorsement refers to FHA‘s approval for mortgage insurance under the Home Equity Conversion Mortgage (HECM) program and is synonymous with the origination of a HECM loan. See 24 CFR 206.15.
- Federal Housing Administration, “Annual Report to Congress Regarding the Financial Status of the Federal Housing Administration Mutual Mortgage Insurance Fund,” https://www.hud.gov/sites/dfiles/Housing/documents/2022FHAAnnualRptMMIFund.pdf . Table D-22 shows that there were 64,437 HECM loans endorsed in 2022. The number of these loans declined from 48,329 in 2018 to 31,272 in 2019 and increased each year from 2020 through 2022.
- Tables D-22 and D-29, FHA report.
- Competiscan uses self-reported income data. This analysis tracks all households that received reverse mortgage advertising, which is not limited to households with homeowners age 62 and over. For more on methodology, see Analysis of Direct Marketing Volume.
- According to CFPB analysis of 2021 1-year American Community Survey data, about 53 percent of older homeowners had household income below $75,000.
- According to CFPB analysis of 2021 Census Bureau American Community Survey (ACS) data, 61 percent of older homeowners (age 62 and above) lived in the South or West Census regions.
- CFPB analysis of (a) HUD’s FHA HECM Single Family Portfolio Snapshot (2021-2022) found at https://www.hud.gov/program_offices/housing/rmra/oe/rpts/hecmsfsnap/hecmsfsnap .
- Measured by the percent of homeowners 62 and older answering Yes to the question “In the past 12 months, which of the following describes your experience with credit cards? - In some months, I carried over a balance and was charged interest.” (Variable F2_2).
- Measured by the percent of homeowners 62 and older answering Yes to the question “Do you currently have any unpaid bills from a health care or medical service provider (e.g., a hospital, a doctor's office, or a testing lab).” (Variable G20).
- Measured by the percent of homeowners 62 and older with a mortgage answering Somewhat or Very Difficult to the question “In the last 7 days, how difficult has it been for your household to pay for usual household expenses, including but not limited to food, rent or mortgage, car payments, medical expenses, student loans, and so on?” (Variable EXPNS_DIFF).
- Measured by the percent of homeowners 62 and older with a mortgage answering No to the question “Is this household currently caught up on mortgage payments?” (Variable MORTCUR).
- Advertisements were tagged if they included the term “refinance” in their body and were further limited to advertisements using terms such as “your existing/current reverse mortgage” to identify targeting towards existing reverse mortgage customers.
- This analysis looks at advertising targeted towards existing reverse mortgage borrowers with messages about refinancing their reverse mortgages. An additional set of advertisements, not included in the tallies, also used the term “refinance” to promote homeowners with an existing mortgage procure or “refinance to” a reverse mortgage.
- FHA data show that the share of HECM endorsements that were refinance loans, and the share of HECM Maximum Claim Amount for refinance transactions, increased in fiscal years 2021 and 2022 compared to previous years. Tables D-22 and D-29, FHA report. Monthly HECM snapshots show that the share of HECM endorsements that were refinances reached 50 percent in the second half of 2021 and the first half of 2022 but declined to 15 percent by the end of 2022.
Page last modified @