Medical debt among older adults before the pandemic
By the CFPB Office for Older Americans – NOV 15, 2021
Contact the Office for Older Americans: olderamericans@cfpb.gov
In 2018, 4.5 million adults ages 65 and older had medical debt, and many experienced significant hardships. This data spotlight describes the characteristics of older adults with medical debt, measured as having a past due medical bill, using the most recent data from the FINRA Foundation National Financial Capability Study (NFCS).
Nearly one in 10 (4.5 million) older adults had medical debt in 2018
In 2018, 8.5 percent of older Americans had medical debt, measured as having a past due medical bill. That’s a total of 4.5 million adults ages 65 and older, according to U.S. Census estimates.1 The incidence of medical debt is lower among adults ages 65 and older compared to younger age groups. This finding is likely the result of older Americans having the highest health insurance coverage rates of all age groups due to their eligibility for coverage through Medicare.2 However, Medicare coverage is limited. For example, Medicare does not typically cover common needs that tend to increase with age, such as routine hearing, vision, and dental care. Consequently, these common non-covered expenses lead to large out-of-pocket costs for Medicare beneficiaries,3 which in turn, contribute to carrying medical debt.4
Medical debt is more common among older people of color, older adults with incomes near the poverty line, people who are uninsured, who are currently unmarried, and who don’t own a home
Non-White older adults and older adults who are not married more often report medical debt than their counterparts.5 For nearly all age groups, but especially among adults ages 65 and older, medical debt is most common among individuals with an annual household income of between $15,000 and $25,000. These individuals have household incomes just above the threshold to qualify for the additional coverage and support through the Medicare Savings Programs and the Medicare Part D Extra Help program, two key programs that reduce out-of-pocket medical expenses for Medicare beneficiaries. Older adults without health insurance coverage are more likely to report having medical debt than older adults with health insurance.6
Percent of older adults with medical debt by selected characteristics, 2018
Notes: *Non-white, includes Hispanics. **Non-married category combines: widows/ers, separated, divorced, and never married. ***Other category includes renters and individuals living in a home without payment. ****Income is measured at the household level.
Racial disparities in who holds medical debt increase with age. Differences between women and men decrease with age
The analysis shows unique patterns in the relationships between medical debt and race and gender by age group. These patterns result in an increasing gap between White and non-White individuals in the percentage of adults with medical debt by age. For example, there is a less than 2 percent difference in the incidence of medical debt between White and non-White consumers ages 25 to 54. This difference increases to nearly 7 percent for ages 65 and older. This finding aligns with other studies that show large disparities in out-of-pocket health care costs by race/ethnicity in older age groups, with older adults of color spending more on these costs.7
By contrast, differences between men and women holding medical debt decrease with age. Women are generally more likely to have medical debt than men. However, medical debt is roughly 10 percent more common for women than for men between the ages of 35 and 54. This difference decreases to 2 percent between women and men ages 65 and older.
Figure 3: Difference in the percent of adults with medical debt by race, gender, and age group, 2018
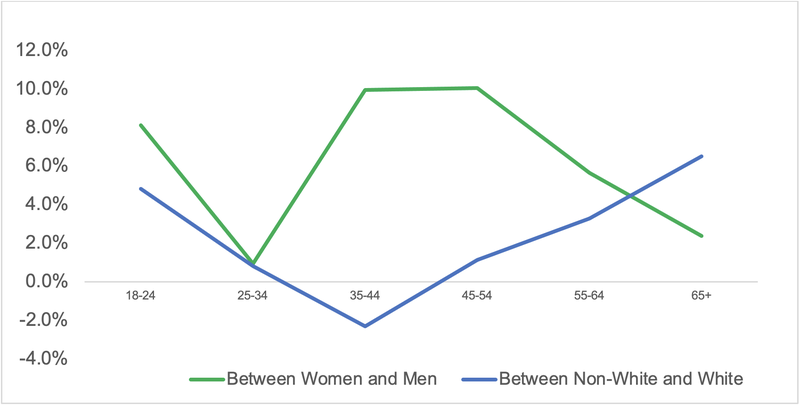
Source: CFPB estimates using data from the FINRA Foundation National Financial Capability Study public-use data. See About the FINRA Foundation National Financial Capability Study section for more details on the data and methodology. The difference by race is computed by subtracting the percent of non-White adults with medical debt from the percent of White adults with medical debt. The difference by gender is computed by subtracting the percent of women with medical debt from the percent of men with medical debt.
Three-fourths of older adults with medical debt are retired
Most older adults with medical debt (76 percent) are retired, while 17 percent are employed and 7 percent are disabled, sick or unable to work. Additionally, 25 percent of older adults with medical debt reported a large decrease in household income within the last 12 months. A recent job loss, declining health, or the onset of a disability could help explain this intersection between employment status, medical debt, and a drop in income.
Figure 4: Differences in employment status between older adults with and without medical debt, 2018
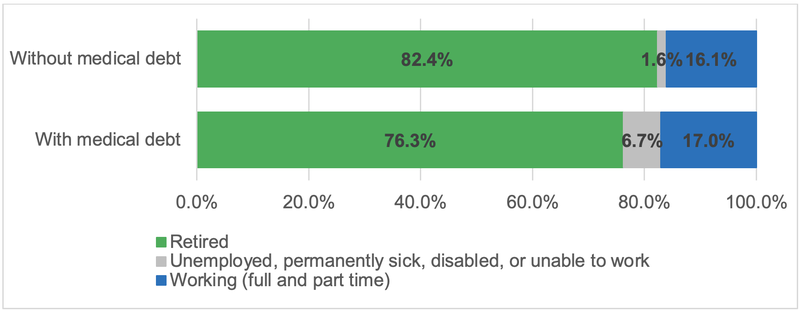
Source: CFPB estimates using data from the FINRA Foundation National Financial Capability Study public-use data. See About the FINRA Foundation National Financial Capability Study section for more details on the data and methodology.
Medical debt is strongly related to skipping medical care and other hardships
Older adults with medical debt were more likely to report significant cost-related health care challenges and hardships than their peers without medical debt. One-third (33.8 percent) of older adults with medical debt say they have skipped a medical treatment or doctor’s visit due to cost. By contrast, only 6 percent of older adults without medical debt report skipping healthcare because of cost concerns. Similarly, one-third (34.2 percent) of older adults with medical debt say that they did not fill a prescription due to cost. Only 5.4 percent of older adults without medical debt said the same. Lastly, 19 percent of older adults with medical debt reported that they find it very difficult to cover their monthly expenses and bills, compared to only 3 percent of older adults without medical debt.
Figure 5: Differences in experiences of material hardship between older adults with and without medical debt, 2018
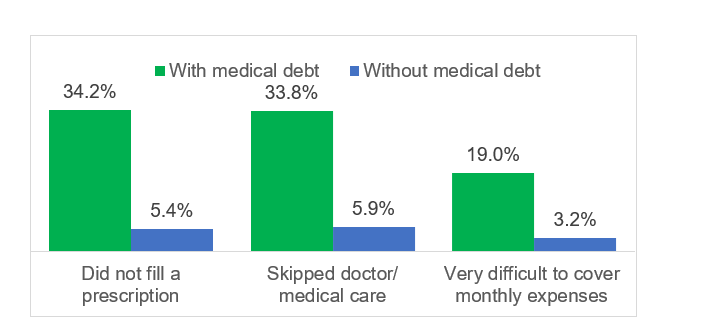
Source: CFPB estimates using data from the FINRA Foundation National Financial Capability Study public-use data. See About the FINRA Foundation National Financial Capability Study section for more details on the data and methodology.
Many older adults with medical debt carry other debts, have low credit standing and are contacted by collectors
The analysis shows that older adults with medical debt are financially active in the credit space, and at a higher rate than those without medical debt. For example, 39.0 percent of older adults with medical debt have an auto loan and 8.2 percent have a student loan, compared to 25.0 percent and 4.0 percent among older adults without medical debt. Of the older adults who own their homes, 49.6 percent have a mortgage compared to only 34.3 percent among those who do not have medical debt.
Older adults with medical debt differ most notably from older adults without medical debt in their experiences with debt collection and their credit standing. In 2018, 41.2 percent older adults with medical debt were contacted by a debt collector compared to only 2.8 percent of adults without medical debt. A similar wide gap is found for self-assessments of credit standing, where 27.3 percent older adults with medical debt reported having bad or very bad credit compared to only 1.7 percent of older adults without medical debt.
These findings indicate greater financial hardship among many older adults with medical debt. Along with the tendency among older adults with medical debt to skip health care treatments, these findings highlight the importance of improving access to affordable health care, and ensuring that medical debt collectors adhere to fair debt collection and fair credit reporting laws.
Help for older adults with medical debt
- Learn about your debt collection rights and protections
- Help if you’re wrongfully billed for Medicare costs
- Find help in your community through the Eldercare Locator
- Submit a complaint if you have an issue with your medical debt or a debt collector
Endnotes
- U.S. Census Bureau, 2018 American Community Survey, Table DP05: Demographic and Housing Estimates, available at https://data.census.gov/cedsci/table?d=ACS%205-Year%20Estimates%20Data%20Profiles&table=DP05&tid=ACSDP5Y2019.DP05
- U.S. Census Bureau, Health Insurance Coverage in the United States: 2020, available at https://www.census.gov/content/dam/Census/library/publications/2021/demo/p60-274.pdf .
- Adults ages 65 and older have higher out-of-pocket health care costs on average than any other age group. See Gwet, P. et al, Out-of-Pocket Health Care Expenses in the U.S. Civilian Noninstitutionalized Population by Age and Insurance Coverage, 2014, available at https://meps.ahrq.gov/data_files/publications/st495/stat495.shtml .
- The survey, in fact, shows that the vast majority (97 percent) of older adults with medical debt have health insurance coverage.
- The public-use version of the NFCS does not provide detailed race/ethnicity categories. The survey groups respondents in two categories: White, Non-Hispanic and Non-White (see variable: A4A_new_w).
- It is important to note that the vast majority of individuals (97 percent) of older adults with medical debt in the survey have health insurance.
- Lee, C., Black Medicare Beneficiaries Are More Likely Than White Beneficiaries to Have Cost-Related Problems with Their Health Care, Across both Traditional Medicare and in Medicare Advantage Plans (2021), available at https://www.kff.org/medicare/press-release/black-medicare-beneficiaries-are-more-likely-than-white-beneficiaries-to-have-cost-related-problems-with-their-health-care-across-both-traditional-medicare-and-in-medicare-advantage-plans .
Page last modified @