Mortgage data shows that borrowers could save $100 a month (or more) by choosing cheaper lenders
In this blog we take a look at how mortgage rates paid by consumers vary across lenders. This phenomenon, called price dispersion, exists in virtually every segment of the mortgage market, including loans backed by Fannie Mae and Freddie Mac, Federal Housing Administration loans, U.S. Department of Veterans Affairs (Veterans Affairs) loans, as well as jumbo loans.1 We analyzed Home Mortgage Disclosure Act data from 2021 to quantify the magnitude of price dispersion.2
We found that price dispersion for mortgages is often around 50 basis points of the annual percentage rate. To put this number in context, the median loan amount in 2021 was close to $300,000 and the median interest rate was 3 percent.3 The monthly payment for such a 30-year fixed loan is $1,265. The monthly payment for a 3.5 percent interest rate loan on a loan of the same amount is $1,347 – a difference of $82 a month (a 6.5 percent higher payment). Interest rates have increased drastically since 2021, but the math remains similar in a higher-interest rate environment. Keeping the loan amount at $300,000, the monthly payments for a 30-year fixed loan with a 6.5 percent interest rate and a 7 percent interest rate are, respectively, $1,896 and $1,996 – a difference of $100 a month (a 5.3 percent higher payment). In a higher interest-rate environment, with monthly payments being much higher overall, this $100 a month difference might matter even more as borrowers potentially are more stretched to make ends meet.
How we analyzed mortgage data for price dispersion
For our analyses we use Home Mortgage Disclosure Act data from 2021. We only focus on and report the numbers for the 20 largest-volume lenders for each of the market segments.4 Several previous studies documented the existence of price dispersion in the mortgage market,5 but this is the first report to use new Home Mortgage Disclosure Act data – reported by the vast majority of mortgage originators throughout the country – with multiple variables necessary for our analysis.6 Our results are largely consistent with previous studies, despite previous studies often using either rate sheet data and/or selected data on originations from private providers without coverage comparable to the Home Mortgage Disclosure Act. It is particularly notable that earlier studies considered pre-pandemic data, which does not have the same historic volume of refinance loans. We apply a multitude of filters to the data, to make our sample as homogeneous as possible, in order to rule out many of the variables that could be responsible for price differences. We filter for:
- first-lien purchase loans,
- owner-occupied (principal residence),
- originated in the middle half of 2021 (when the interest rates were particularly stable),
- zero discount points as reported under the Home Mortgage Disclosure Act,
- directly originated loans (as in, not resold through wholesale and not through correspondents),
- 30-year,
- fixed-rate,
- non-manufactured housing,
- made to consumers with a debt-to-income ratio less than or equal to 43 percent; for Government Sponsored Entities, Federal Housing Administration, and Veterans Affairs loans we restrict our sample to loan amounts between $200,000 and $548,000 (the baseline conforming loan limit that year).
Price dispersion by loan type
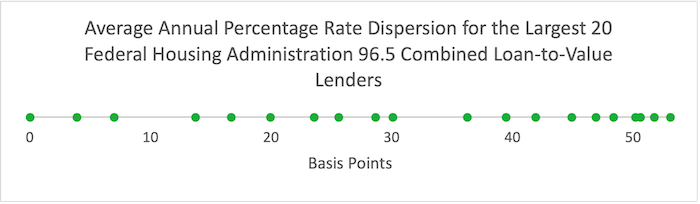
Federal Housing Administration loans are arguably the most relevant segment for expanding homeownership as they are disproportionately used by lower-income, lower credit score borrowers, and first-time homebuyers. The Federal Housing Administration’s insurance pricing also makes it easy to evaluate price dispersion while keeping everything else equal. In particular, the Federal Housing Administration’s most popular loan of 3.5 percent down payment (loan-to-value ratio of 96.5) is insured by the Federal Housing Administration at the same insurance rate, regardless of the borrower’s credit score or debt-to-income ratio if the borrower qualifies . Figure 1 is an interval showing the average annual percentage rate of an originated loan for each of the Federal Housing Administration’s top 20 lenders across loans that meet our filters, with the cheapest lender normalized to 0. Figure 1 shows that the dispersion between the highest and the lowest top 20 Federal Housing Administration lenders is 53 basis points, and it is not driven by one outlier lender either on the low end or on the high end. Plotting origination volumes of the top 20 lenders against these average prices does not produce a clear relationship – it is not the case that the cheapest lenders systematically get much higher volumes than the pricier ones.7
Figure 1: Relative annual percentage rate spread of averages for top 20 Federal Housing Administration lenders for 96.5 combined loan-to-value ratio loans, Home Mortgage Disclosure Act 2021
Averages might work reasonably well for this Federal Housing Administration subsegment of combined loan-to-value ratio of 96.5, but even there we are mixing loans originated throughout the middle half of 2021. In contrast to FHA, the Government Sponsored Entities (Fannie Mae and Freddie Mac) use nuanced risk-based pricing (loan-level price adjustment matrix) to guarantee loans.8 Accordingly, we run pricing regressions that flexibly control for various factors, including credit score, combined loan-to-value ratio, and application date.9 We also include indicator variables for each lender which effectively capture that lender’s average effect once we control for all the other variables in the regression.10
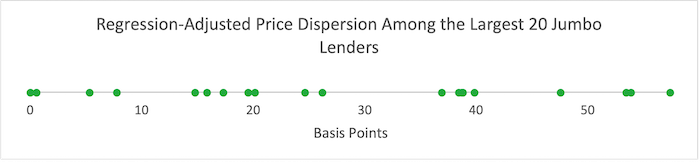
We show four figures for different segments of the market: Government Sponsored Entities, Federal Housing Administration, Veterans Affairs, and the jumbo market.11 As in the analysis above, we normalize the cheapest lender in each segment to 0 basis points. The figures show that regression-adjusted price dispersions for the four segments are, respectively, 41, 61, 64, and 57 basis points.
Figure 2: Relative regression-adjusted annual percentage rate averages for the top 20 Fannie Mae and Freddie Mac lenders, Home Mortgage Disclosure Act 2021
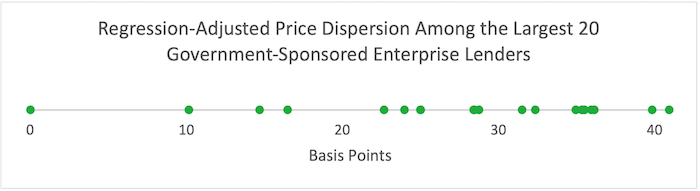
Figure 3: Relative regression-adjusted annual percentage rate averages for the top 20 Federal Housing Administration lenders, Home Mortgage Disclosure Act 2021
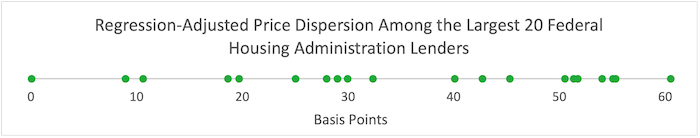
Figure 4: Relative regression-adjusted annual percentage rate averages for the top 20 Veterans Affairs lenders, Home Mortgage Disclosure Act 2021
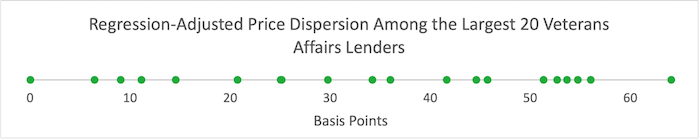
Figure 5: Relative regression-adjusted annual percentage rate averages for the top 20 Jumbo lenders, Home Mortgage Disclosure Act 2021
As noted, a 50 basis point difference amounts to over $1,000 a year for a typical mortgage. For comparison, the U.S. Department of Housing and Urban Development recently announced a 30-basis-point reduction in the Federal Housing Administration mortgage insurance premium, with the White House noting that it could save $800 a year for Federal Housing Administration consumers . Our figures suggest that borrowers choosing even the median-priced lender could save approximately the same amount if their mortgages were priced at the level of the lowest-priced large lender.12 As another comparison, 50 basis points yearly is comparable to the Government Sponsored Entities loan-level price adjustment differences between borrowers with credit scores below 620 and borrowers with credit scores above 740 – the Government Sponsored Entities adjustment difference between under 620 and over 740 borrowers is a 2.5 percent one-time charge, or $7,500 for a $300,000 loan.13 That difference is comparable with $100 a month savings (or 50 basis point interest rate difference) as long as the duration of the mortgage is around six years, which is likely an underestimate for loans originated shortly before or during the pandemic.
Reasons for price dispersion
Why is there so much price dispersion, even though the underlying financial instrument is essentially the same (say, a 30-year fixed rate Fannie Mae loan)? There are several potential reasons:
- Lenders are not the same: some retain servicing, some market themselves on speed and ease of closing transactions, and some have physical branches near consumers. Some of these differences mean that lenders have different costs and some of these differences mean that consumers might not simply choose the cheapest lender. For some consumers, it is possible that these factors might outweigh the price differences – just like in retail a consumer might want to shop at the closest store or the cleanest store or a store that offers the same product for less, even if lacking other desirable attributes.14
- Competition in the mortgage market is not always channeled into lower prices. Consumers might not understand the trade-offs that they are making and might not realize how much they could save by shopping around for a mortgage, allowing lenders to retain a lot of demand even when their prices are higher. In the National Survey of Mortgage Originations – a survey jointly administered by the CFPB and the Federal Housing Finance Agency – most borrowers who recently took out a mortgage responded that they believe they would pay the same price regardless of which lender they choose. This is consistent with the shopping behavior documented by the same survey: the plurality of borrowers only seriously consider one lender, and few borrowers consider more than two. The Consumer Financial Protection Bureau has published previous materials encouraging borrowers to shop for mortgages and advising them how to.
- Especially during periods of increased demand (such as 2021), lenders might try to use price for rationing demand . In other words, if a lender is experiencing demand beyond the volume it can handle, the lender may raise their prices to discourage some consumers from seeking their loans. They would continue to raise prices until enough consumers turn to other options and the lender returns to their optimal loan volume. However, previous research showed similar price dispersion in other time periods.
- Lenders with less restrictive overlays (borrowing requirements in addition to those imposed by the Government Sponsored Entities, Federal Housing Administration, or Veterans Affairs) might charge higher prices, to compensate for the additional risk. However, our regression adjustments control for many of the traditionally used risk indicators. Moreover, we exclude borrowers with credit scores under 640 or debt-to-income ratios over 43 percent from our regressions for exactly those concerns. We also see that the average price differences for borrowers with credit scores under 640, without controlling for other factors, are around 10 basis points (far from explaining the price dispersion that we see).
The views expressed here are those of the authors and do not necessarily reflect the views of the Consumer Financial Protection Bureau. Links or citations in this post do not constitute an endorsement by the Bureau.
Endnotes
- In general, price dispersion is when different firms charge consumers different prices for the same or very similar products. While price dispersion occurs in many markets, groceries are often the most studied market, since price dispersion is relatively easy to observe across different retailers. See, e.g., https://www.aeaweb.org/articles/pdf/doi/10.1257/mic.20170126 .
- There are also two downstream effects that could potentially stem from borrowers receiving lower-priced mortgages: fewer foreclosures due to lower monthly payments and, in turn, less risk for the government See, e.g., https://www.cbo.gov/sites/default/files/114th-congress-2015-2016/workingpaper/50871-FHA.pdfhttps://www.cbo.gov/sites/default/files/114th-congress-2015-2016/workingpaper/50871-FHA.pdf (showing that reducing payment size by 1% could lead to reducing foreclosure probability by 2%) and https://www.jpmorganchase.com/content/dam/jpmc/jpmorgan-chase-and-co/institute/pdf/institute-mortgage-debt-reduction.pdf.
- https://files.consumerfinance.gov/f/documents/cfpb_data-point-mortgage-market-activity-trends_report_2022-09.pdf , Table 3a page 25 – $289,000 to be exact, however, we use $300,000 for the calculations above for clarity.
- With thousands of lenders, it’s easy to find dispersion since some of the smallest lenders might be outliers for idiosyncratic reasons.
- See, e.g., https://papers.ssrn.com/sol3/papers.cfm?abstract_id=2948491 and https://www.federalreserve.gov/econres/feds/paying-too-much-price-dispersion-in-the-us-mortgage-market.htm .
- Before 2019, mortgage originators were only required to report the annual percentage rate (technically, spread over APOR) for higher-priced loans, an unrepresentative sliver of the market (considerably less than 10 percent most years). Since 2019, mortgage originators are required to report this variable for all loans and are also required to report credit score, combined loan-to-value ratio, debt-to-income ratio, making it easier to compare loans apples-to-apples for all originators.
- Due to supervisory nature of the data, we do not show these plots, as an informed reader might be able to recognize the identities of the lenders.
- Lenders also might be pricing in some risk over and above the cost of guarantees, see for example https://www.fhfa.gov/PolicyProgramsResearch/Research/PaperDocuments/wp2301.pdf.
- As of the publication date, lenders use debt-to-income ratio for underwriting but not typically for pricing, so we exclude it from our regression.
- We also use Government Sponsored Entities’ loan-level price adjustment to run regressions described above within each of the matrix’s cells (for example, a regression only for Government Sponsored Entities consumers with combined loan-to-value ratios from 75 to 80 and credit scores from 640 to 660), to further ensure more accurate comparisons. These results are consistent with the results we show in Figure 2. In addition to filtering loan amounts, we also ran a regression specification that controls for the loan amount, with result also consistent with Figure 2.
- For the jumbo market, we use loan amounts of $823,000 and above that are not guaranteed by Veterans Affairs or securitized by Ginnie Mae.
- It may initially seem intuitive that borrowers at the median-priced lender who switch to the lowest-priced large lender should save $500 a year, but the differences in price are not uniformly distributed. More top lenders are on the higher end of pricing versus the lower end, meaning the median is greater than just half of the maximum difference, which is what you would expect if it were a uniform distribution.
- We also assume a 20 percent down payment and that all else is equal.
- We only find a weak correlation between the latest JD Power mortgage origination satisfaction rankings (https://www.jdpower.com/business/press-releases/2022-us-mortgage-origination-satisfaction-study ) and the price rank of the lenders that we observe for the Government Sponsored Entities segment of the market.