The Financial Security of Small Business Owners: Evidence from the Making Ends Meet Survey
Small businesses1 are critical to the U.S. economy, employing 47 percent of workers and generating 38 percent of private sector revenue.2 Owners of small businesses often rely on their personal assets and consumer credit to finance their enterprises. Thus, small business owners face unique challenges that may ultimately impact both their personal and business finances. In this analysis, we examine the personal financial circumstances of small business owners using the Consumer Financial Protection Bureau’s Making Ends Meet survey. The results of the analysis found that:
1) Small business owners experience more volatility in their personal income than individuals who do not own a business. Small business owners were nearly twice as likely to report that their income varied from month to month. Small business owners were over 20 percentage points more likely to have experienced a drop in income. They were also more likely to have experienced an unexpected expense, to have incurred a credit card late fee, and to have frequently incurred overdraft or insufficient funds fees in the past year. We find this despite also finding that small business owners generally have higher income, savings, and household wealth than non-owners.
2) The relationship between small business ownership and income volatility varies across racial and ethnic groups. White business owners experience significantly more income volatility than white individuals who don't own businesses. In contrast, Black and Hispanic business owners show similar levels of income volatility to Black and Hispanic non-owners. When comparing between business owners of different backgrounds, white business owners tend to have higher income volatility than Black and Hispanic business owners, though this difference is not statistically significant.3
3) Small business owners appear to experience different types of credit constraints than non-owners. While small business owners and non-owners appeared to apply for credit at similar rates, small business owners were more likely to be turned down or not receive as much credit as they requested compared to non-owners.
Data and Methods
The Making Ends Meet survey asks questions about a consumer’s financial wellbeing, how they cope with shortfalls, and how they deal with financial difficulties. Respondents are drawn from the CFPB’s Consumer Credit Panel, and the survey results are weighted to be representative of the Consumer Credit Panel and consumers with a credit record. More information about the Making Ends Meet survey and methodology can be found in the CFPB’s 2023 report.
In the 2023 survey waves, the CFPB added questions allowing respondents to identify whether they owned a business, if the business was their primary income source, and if the respondent had a business line of credit. In response, 13% of Making Ends Meet survey respondents answered “yes” to owning a business and are counted as small business owners for the purposes of this analysis. This percentage is very similar to the 14.3% of families in the 2022 Survey of Consumer Finances that reported having business equity.4 Half (49.5%) of small business owners reported that the business is their primary income source and 40.6% of small business owners reported having a separate line of credit or credit card for their business. Business ownership does not perfectly correlate with being “self-employed,” as only 75% of self-employed respondents reported being small business owners and 62% of small business owners reported being self-employed.
Small business owners generally have higher income, savings, and household wealth than non-owners.
We find that small business owners generally have higher income, savings, and household wealth than non-owners.5 Consistent with previous research , we also find that small business owners tend to be older than non-owners, have higher levels of education and are more likely to be white, male, and married.6 Table 1 shows response breakdowns to several related questions separately for small business owners and non-owners. Small business owners are more likely to report having incomes in the highest two categories and are statistically significantly more likely to have $20,001 or more in their checking and savings accounts. Additionally, we find that they are more likely to be saving for retirement, report having money in stocks, bonds or mutual funds, and their households are more likely to own a home.7
Why do small business owners have higher income and higher wealth? There are two possible (related) reasons. First, individuals with high income and wealth could be more likely to start businesses. Alternatively, small business ownership could make individuals better off by generating more wealth and income. The survey does not allow us to determine which possibility drives our findings and we caution against interpreting our results as causal. We do, however, note that small business owners are more likely to have demographic characteristics associated with higher wealth and income.
TABLE 1: Descriptive statistics related to income, savings, and wealth of small business owners and non-owners.
| Survey Question and Response | Non-Owners (%) | Small Business Owners (%) |
|---|---|---|
Income: $20,000 or less |
17.7 |
10.6 |
$20,001 - $50,000 |
32.2 |
23.2 |
$50,001 - $80,000 |
18.6 |
20.6 |
$80,001 - $125,000 |
17.5 |
19.1 |
$125,001 or more |
14.0 |
26.5 |
Amount in household checking and savings accounts: $0 |
5.1 |
3.1 |
Less than $100 |
15.8 |
10.3 |
$101 to $500 |
13.9 |
9.4 |
$501 to $1,000 |
10.4 |
10.3 |
$1,001 to $5,000 |
17.3 |
16.1 |
$5,001 to $10,000 |
8.7 |
8.9 |
$10,001 to $20,000 |
7.8 |
8.9 |
$20,001 or more |
21.0 |
33.0 |
Is anyone in your household currently saving for retirement?: Yes |
42.3 |
59.6 |
Household has any stocks/bonds/mutual funds outside of retirement accounts?: Yes |
27.3 |
39.8 |
Do you or someone in your household own your current residence?: Yes |
56.3 |
68.6 |
Small business owners experience more volatility in their personal finances than non-owners.
Despite having higher levels of income, savings, and wealth, we find evidence that small business owners’ personal finances are much more volatile than those of non-owners. Figure 1, below, graphs the percentage point difference between small business owners and non-owners on several questions related to financial volatility. Because we might expect small business owners to have more financial stability based on their demographic characteristics, we display raw differences as well as differences after a simple adjustment for income and age. In Figure 1, we record a respondent as having “volatile” income if they indicate that their income varies “somewhat” or “a lot” from month to month.8 Small business owners are over 30 percentage points more likely to report having volatile income than non-owners. Small business owners are much more likely to report income varying “somewhat” (41 percent) compared to non-owners (21 percent) and are also much more likely to report income varying “a lot” (16 percent) compared to non-owners (6 percent).
In the 12 months prior to responding to the survey, small business owners were also over 20 percentage points more likely to have experienced a drop in income. The median reported drop in income for small business owners who experienced an income drop was $10,000. We also find that small business owners are more likely to have experienced an unexpected expense, to have incurred a credit card late fee, to have frequently (3 or more times) incurred an overdraft fee, or to have frequently (3 or more times) incurred an insufficient funds fee. The difference in frequently incurring overdraft fees is statistically significant.9
FIGURE 1: Differences in income volatility and related measures between small business owners and non-owners
![Figure 1: A dot and whisker plot showing the unadjusted and income-age adjusted difference between small business owners and non-owners for seven metrics of income volatility. The y-axis is the seven metrics of income volatility: volatile income, any drop in income, difficulty paying bills, any unexpected expense, credit card late fees, more than 3 overdraft fees, and more than 3 NSF fees. The x-axis is the difference between small business owners and non-owners in percentage points. The line color is unadjusted or adjusted difference. The dot is the coefficient estimate and the whiskers are the confidence interval. The unadjusted difference in volatile income between small business owners and non-owners is 30.1 percentage points with a confidence interval of [22.9, 37.4], the adjusted difference is 32 with a confidence interval of [24.9, 39.1]. For any drop in income, the unadjusted difference is 20.6 with a confidence interval of [13.2, 28.1], and the adjusted difference is 23.1 with a confidence interval of [15.8, 30.5]. For difficulty paying bills, the unadjusted difference is -.5 with a confidence interval of [-7.9, 6.8], and the adjusted difference is 4.6 with a confidence interval of [-2.4, 11.6]. For any unexpected expense the unadjusted difference is 6.5 with a confidence interval of [0, 13.1], and the adjusted difference is 6.2 with a confidence interval of [-0.2, 12.7]. For credit card late fees, the unadjusted difference is 3.7 with a confidence interval of [-3.8, 11.3], and the adjusted difference is 3.5 with a confidence interval of [-3.4, 10.6]. For more than 3 overdraft fees, the unadjusted difference is 6.4 with a confidence interval of [0.1. 12.7], and the adjusted difference is 9 with a confidence interval of [2.3, 15.6]. For more than 3 NSF fees, the unadjusted difference is 4.8 with a confidence interval of [-0.4, 10.1], and the adjusted difference is 5.6 with a confidence interval of [0, 11.2].](https://files.consumerfinance.gov/f/images/cfpb_the-financial-security-of-small-business-.width-800.png)
NOTE: The unadjusted and the income and age-adjusted percentage point difference between small business owners and non-owners in measures of financial volatility. Small business owners are more likely to report financial volatility than non-owners. Error bars represent 95% confidence intervals.
The differences in income volatility between small business owners and non-owners seem to differ by race/ethnicity. As Figure 2 shows, white business owners experience significantly more income volatility than white individuals who don't own businesses. In contrast, Black and Hispanic business owners show similar levels of income volatility to Black and Hispanic non-owners. When comparing between business owners of different backgrounds, white business owners tend to have higher income volatility than Black and Hispanic business owners, though this difference is not statistically significant.
FIGURE 2: Income volatility by race and small business owner status
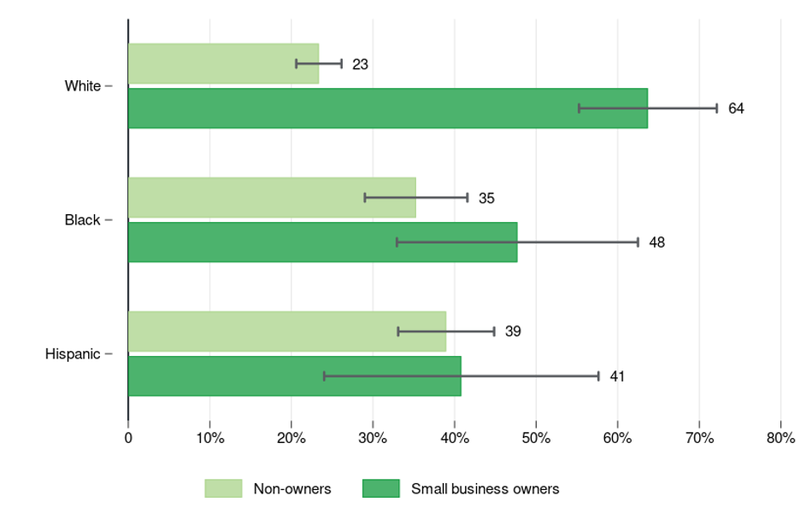
NOTE: White small business owners report higher and statistically significant income volatility than white non-owners. Black and Hispanic small business owners do not report much more income volatility than their non-owner counterparts. Black and Hispanic non-owners report more income volatility than white non-owners. Figure excludes groups with fewer than 50 respondents. Error bars represent 95% confidence intervals.
Small business owners appear to experience different types of credit constraints than non-owners.
Lastly, small business owners appear to experience some differences in credit constraints compared to non-owners.10 On the Making Ends Meet survey, respondents were asked 1) if they considered applying for credit but did not because they expected to be turned down, 2) if they applied for credit in the previous 12 months, and 3) conditional on applying, if they were turned down for credit or did not receive as much as they had asked for. Respondents could be considering business credit, personal credit, or both when answering these questions because the survey does not specify a type of credit. Figure 3, below, plots the percentage point differences in responses between small business owners and non-owners in a similar manner to Figure 1, with an unadjusted difference and a difference adjusted for income and age. Small business owners had slightly higher rates of having considered but not applied for credit than non-owners. While small business owners and non-owners appeared to apply for credit at similar rates, small business owners were more likely to be turned down or not receive as much credit as they requested compared to non-owners. This difference is even more stark when adjusting for age and income-differences.
FIGURE 3: Differences in credit application and access between small business owners and non-owners.
![Figure 3: A dot and whisker plot showing the unadjusted and income-age adjusted differences between small business owners and non-owners for three metrics of credit access. The y-axis is the three metrics; applied for credit, turned down or received less than requested, and considered, but decided not to apply. The x-axis is the difference between small business owners and non-owners in percentage points. The line color is unadjusted or adjusted. The dot is the coefficient estimate and the whiskers are the confidence interval. The unadjusted difference in applying for credit between small business owners and non-owners is 2.5 percentage points with a confidence interval of [-5, 10]. The adjusted difference is 0 with a confidence interval of [ -7.5, 7.5]. For turned down or received less than requested, the unadjusted difference is 8.47 percentage points with a confidence interval of [-3.3, 20], the adjusted difference is 13.6 percentage points with a confidence interval of [ 2.4, 20.5]. For considered, but decided not to apply, the unadjusted difference is 2.98 percentage points with a confidence interval of [ -3.9, 9.9], the adjusted difference is 5.69 percentage points with a confidence interval of [ -1.3, 12.7]. Source: Making Ends Meet Survey. Includes responses from the 2023 sample and responses from 2022 respondents who received a follow-up survey in 2023.](https://files.consumerfinance.gov/f/images/cfpb_the-financial-security-of-small-business-.width-800_qDHL4qq.png)
NOTE: Figure 3 plots the unadjusted and income and age-adjusted percentage point differences in applying for credit and access to credit between small business owners and non-owners. Non-owners and small business owners applied for credit at similar rates. For both the adjusted and unadjusted measures, small business owners were more likely to be turned down or receive less credit than requested than non-owners. Small business owners had slightly higher rates of considering, but not applying for credit than non-owners. Error bars represent 95% confidence intervals.
Conclusion
These results provide evidence that, even with higher income, savings, and wealth, being a small business owner often entails higher income volatility. This higher volatility suggests that small business owners could turn to financial products that allow them to weather income shocks at low costs. Our results additionally suggest that, at least when the survey was conducted, small business owners might have faced difficulty in obtaining the credit they needed for these purposes.
Endnotes
-
Authored by Claire Brennecke, Isabelle Caldwell, and B. Heath Witzen.
↩ -
Calculated from Statistics of U.S. Businesses,2017 and Non-Employer Statistics 2017. U.S. Census Bureau (March 2020), 2017 SUSB Annual Datasets by Establishment Industry [U.S & states, 6-digit NAICS], available at https://www.census.gov/data/tables/2017/econ/susb/2017-susb-annual.html U.S. Census Bureau (2017), Nonemployer Statistics: 2017 [NES Tables 2017], available at https://www.census.gov/programs-surveys/nonemployer-statistics/data/tables.2017.List_1985049284.html#list-tab-List_1985049284
↩ -
Our comparisons are made using samples of the population, and, therefore, it is possible that our measured differences could be due to chance and the composition of our sample. We use “statistical significance” to refer to when measured differences meet widely accepted statistical thresholds with which researchers are comfortable inferring that a difference is “statistically significant” or unlikely to be driven solely by chance. Throughout this analysis, we consider statistical significance at a 5 percent level.
↩ -
See Table 3 of the 2023 Survey of Consumer Finances Report, available at https://www.federalreserve.gov/publications/files/scf23.pdf .
↩ -
We do not analyze overall income, savings, or wealth by race because small sample size limits what we can report with statistical confidence.
↩ -
Small business owners are more likely have ages between 35 and 64 (65%) compared to non-owners (52%). Non-owners are more likely to be under 35 years old (16%) compared to small business owners (12%) and are also more likely to be 65 or older (32%) than small business owners (23%). Small business owners are slightly more likely to be white (56%) than non-owners (51%). Small business owners were more likely to have obtained a college or post-graduate degree (45%) than non-owners (32%). Small business owners were more likely to be male (50%) than non-owners (41%). Small business owners are also more likely to be married or have a partner they share finances with (66%) than non-owners (56%).
↩ -
Higher liquid wealth might play a role in business entry and exit. See, e.g., https://www.jpmorganchase.com/institute/research/small-business/small-business-ownership-liquid-wealth-startup-exit .
↩ -
The Making Ends Meet survey allows a respondent to document whether their income, “is about the same each month,” “varies somewhat from month to month,” or “varies a lot from month to month.” We record income as being “volatile” if the respondent indicates either “varies somewhat...” or “varies a lot...”
↩ -
For a closer examination of frequent overdraft and insufficient funds fees, see the Bureau’s 2023 report using the Making Ends Meet Survey.
↩ -
We do not analyze credit constraints by race because small sample size limits what we can report with statistical confidence.
↩
Page last modified @