Overdraft/NSF Revenue in 2023 down more than 50% versus pre-pandemic levels, saving consumers over $6 billion annually
Q4 2023 data suggest most banks are no longer significantly reducing fees; fees still totaled $5.8 billion in 2023
The CFPB continues to closely monitor trends in overdraft/non-sufficient funds (NSF) fee revenue and practices. With 2023 data now available, we can compare overdraft and NSF revenue last year to 2022, when many banks changed their fee policies, and to pre-pandemic levels. Our most recent analysis finds the following:
- Reported annual overdraft/NSF revenue has dropped by $6.1 billion since before the pandemic – a reduction of more than half – saving the average household who overdrafts $185 per year.1 This reflects a nearly $2 billion annual reduction in NSF fees, and a roughly $4 billion annual reduction in overdraft fees. (This $6.1 billion drop between 2023 and 2019 is larger than the $5.5 billion decline we projected based on Q4 2022 data in our May 2023 analysis.)
- In 2023, overdraft/NSF fees were approximately $1.8 billion lower than in 2022, a 24% decrease.
- However, banks appear to have stopped significantly reducing overdraft fees, as their major policy changes have taken effect and further policy changes have slowed. Following five straight quarterly declines in overdraft/NSF revenue, such revenue remained flat across all quarters of 2023. Even with the substantial reductions in fees versus prior years, consumers paid over $5.8 billion in 2023 in reported overdraft/NSF fees.
- Evidence continues to suggest that financial institutions are generally not increasing other checking account fees to compensate for reduced overdraft/NSF revenue. Across all reporting banks, combined account maintenance and ATM fees remained flat from 2019 to 2023.
Since the CFPB heightened its supervisory attention on overdraft and NSF fees in 2022, financial institutions have agreed to refund over $240 million to consumers—approximately $177 million in unfair unanticipated overdraft fees charged on transactions that were authorized when the consumer had sufficient funds, and approximately $64 million in NSF fees charged on the same transaction that already incurred an NSF fee when it was previously declined. This $240 million reflects $120 million that the CFPB previously announced in October 2023, and an additional more than $120 million that financial institutions have agreed to refund since the period covered by that announcement.2
This current analysis of bank call report data follows our previous analyses of trends in checking account fee revenue, most recently those published in May 2023 and October 2023. The October 2023 spotlight reported that the vast majority of NSF fees have been eliminated. Thus, the remaining revenue being reported as combined overdraft/NSF fee revenue can be largely attributed to overdraft revenue alone.
Overdraft/NSF Fee Revenue
Banks with assets over $1 billion have been required to report overdraft/NSF fee revenue in their call report data since 2015. For each of the five years from 2015 to 2019, the overdraft/NSF revenue reported by these banks totaled $11-12 billion annually.3 Bank overdraft/NSF fee revenue was lower in 2020 and 2021 than before the pandemic, likely primarily due to pandemic-related stimulus checks pushing up average checking account balances.4 In the second half of 2021, overdraft/NSF fee revenue rebounded somewhat. However, this revenue began decreasing again in early 2022 and continued to decrease until the first quarter of 2023, before remaining at level amounts through 2023. The sustained reductions we see today compared to 2019 are likely due to changes in bank policies that started to go into effect toward the end of 2021 and throughout 2022.
The overall reduction in combined overdraft and NSF fees observed in 2023 primarily reflects a full-year effect of changes to bank policies at larger banks, though several larger and some smaller banks did further reduce overdraft and NSF fee revenue during the year. For the full year 2023, combined reported bank overdraft/NSF fee revenue was $5.83 billion, a decrease of 51%, or $6.13 billion, compared to the $11.96 billion reported in 2019, and 24% less than the $7.61 billion reported in 2022 (Figure 1). For the fourth quarter of 2023 alone, overdraft and NSF revenue was approximately $1.5 billion, compared to roughly $1.6 billion in the fourth quarter of 2022, a reduction of roughly 8 percent (Figure 2). However, quarterly overdraft and NSF revenue for all quarters of 2023 were roughly equivalent, suggesting banks have largely finished implementing policy changes.
FIGURE 1: Annual reported overdraft/NSF revenue 2015 to 2023
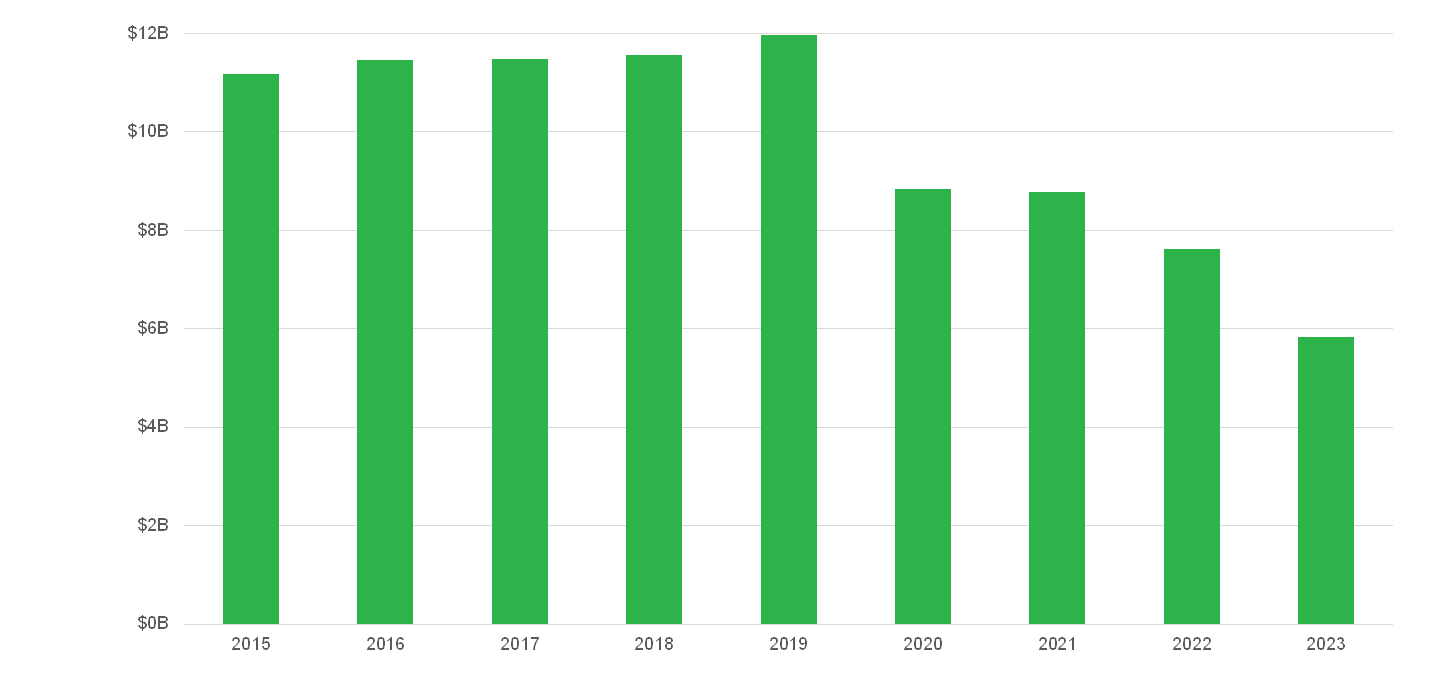
Source: Consolidated Reports of Condition and Income (“Call Reports”), Federal Financial Institutions Examination Council
FIGURE 2: Quarterly reported overdraft/NSF revenue 2019 to 20235
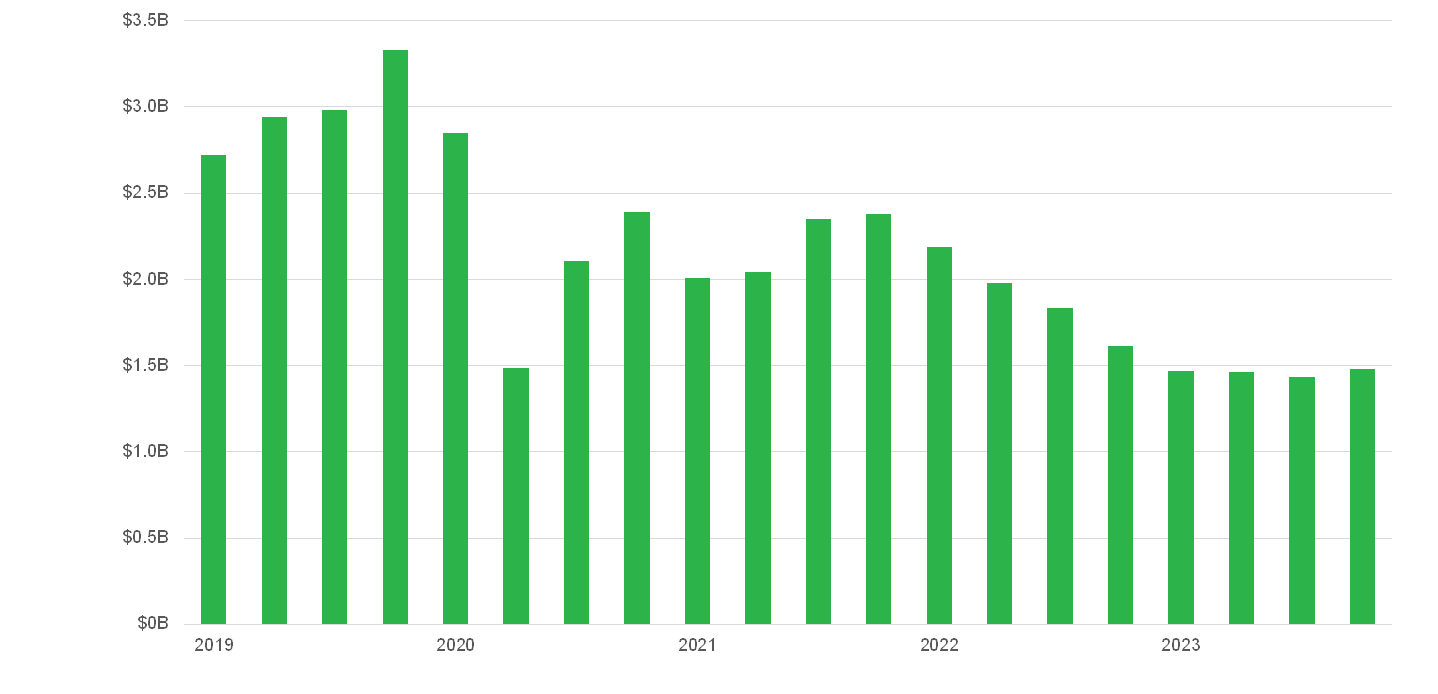
Source: Consolidated Reports of Condition and Income (“Call Reports”), Federal Financial Institutions Examination Council
Despite these declines, reporting banks collected $5.8 billion in overdraft/NSF fees from their customers in 2023. Though many banks have made a range of changes to their policies in recent years, some banks continue to charge overdraft fees as high as $37 each. Overdraft fees can total hundreds of dollars per day, exacerbating financial setbacks. And they can lead to account closures, essentially pricing people out of the banking system.
Table 1 below compares overdraft/NSF revenue in 2023 to 2019 across specific banks and groups of banks. The individual banks listed were the largest overdraft/NSF revenue generators in 2021, with each collecting more than $200 million in these fees. Table 1 also shows trends among four groups of banks that generated $200M or less in overdraft/NSF fee revenue in 2021, consisting mainly of small and midsize banks.6
Table 1: Change in overdraft/NSF fee revenue for the year 2023 versus 2019 for select individual banks and groups of banks7
| Bank or Group | Number of Banks | Group Revenue ($M) Year 2023 | Group Revenue ($M) Year 2019 | $ Change 2023 vs. 2019 | % Change 2023 vs. 2019 |
|---|---|---|---|---|---|
JPMorgan Chase |
- |
$1,104 |
$2,061 |
-$957 |
-46% |
Wells Fargo |
- |
937 |
1,696 |
-759 |
-45% |
PNC |
- |
258 |
540 |
-281 |
-52% |
Truist |
- |
231 |
585 |
-354 |
-61% |
U.S. Bank |
- |
214 |
505 |
-291 |
-58% |
Regions |
- |
211 |
373 |
-162 |
-43% |
TD Bank |
- |
210 |
565 |
-355 |
-63% |
Bank of America |
- |
140 |
1,563 |
-1,423 |
-91% |
Total of select individual banks |
8 |
$3,305 |
$7,889 |
-$4,583 |
-58% |
$50m to $200m |
12 |
735 |
1,813 |
-1,078 |
-59% |
$10m to $50m |
47 |
818 |
1,217 |
-399 |
-33% |
$2m to $10m |
140 |
682 |
726 |
-44 |
-6% |
Under $2m |
410 |
291 |
320 |
-28 |
-9% |
Total |
617 |
$5,831 |
$11,963 |
-$6,133 |
-51% |
Despite the overall decrease in overdraft/NSF fee revenue, we continue to see significant differences across banks and groups of banks. While this evidence is indirect and does not control for changes in the number, composition, or behavior of accountholders, the variations likely reflect, in significant part, changes in overdraft/NSF programs.8
All of the large banks listed have seen decreases in overdraft/NSF revenue of over 40% compared to 2019, and the total decrease across all eight banks was 58%. Specifically:
- Bank of America experienced the most significant decline by far (91%), which likely reflects the reduction of its overdraft fee to $10, the elimination of overdraft fees on ATM withdrawals, and the elimination of NSF fees, among other changes.
- TD Bank, Truist, U.S. Bank, and PNC all experienced declines of over 50%. Among other changes, all four banks eliminated NSF fees; TD Bank, U.S. Bank, and PNC established a grace period until the end of the next day before an overdraft fee is charged; TD Bank and U.S. Bank implemented $50 negative balance cushions; and PNC implemented a limit of one overdraft fee per day.
- JPMorgan Chase, Wells Fargo, and Regions experienced relatively smaller declines ranging from 43% to 46%. All three banks eliminated NSF fees and have introduced a grace period until the end of the next day before an overdraft fee is charged. JPMorgan Chase also implemented a $50 negative balance cushion.
As we did in May 2023, we are also analyzing the change in overdraft/NSF revenue at the individual bank level for the banks that reported between $50 million and $200 million in overdraft/NSF revenue in 2021, reflected in Table 2 below.
Table 2: Change in overdraft/NSF fee revenue for the year 2023 versus 2019 for banks that earned between $50 and $200 million in overdraft/NSF fee revenue in 2021
| Bank | Number of Banks | Assets ($B) 2023 | OD/NSF Revenue ($M) Year 2023 | OD/NSF Revenue ($M) Year 2019 | $ Change 2023 vs. 2019 | % Change 2023 vs. 2019 |
|---|---|---|---|---|---|---|
Woodforest |
- |
$9 |
$123 |
$155 |
-$32 |
-21% |
Fifth Third |
- |
214 |
106 |
127 |
-21 |
-16% |
Citizens |
- |
222 |
100 |
217 |
-117 |
-54% |
Huntington |
- |
189 |
90 |
253 |
-163 |
-64% |
First National Bank Texas/First Convenience Bank |
- |
4 |
87 |
113 |
-26 |
-23% |
Arvest |
- |
28 |
70 |
89 |
-19 |
-22% |
KeyBank |
- |
186 |
66 |
149 |
-83 |
-56% |
M&T |
- |
208 |
42 |
154 |
-111 |
-73% |
BMO Harris |
- |
266 |
27 |
77 |
-50 |
-65% |
USAA |
- |
110 |
21 |
215 |
-194 |
-90% |
Citibank |
- |
1,043 |
2 |
109 |
-107 |
-98% |
Capital One |
- |
475 |
1 |
154 |
-154 |
-100% |
Total |
12 |
$2,953 |
$735 |
$1,813 |
-$1,078 |
-59% |
Capital One and Citibank have both eliminated overdraft and NSF fees entirely, reflected in their ~100% drop in associated revenue compared to 2019. USAA experienced a 90% decline in 2023, having eliminated NSF fees, while beginning to charge overdraft fees on checks and automated clearinghouse (ACH) transactions; the bank still does not charge overdraft fees on debit card point-of-sale or ATM transactions. M&T’s revenues have dropped 73% since 2019, likely reflecting the reduction of its overdraft fee to $15 and a limit of one overdraft fee per day, along with the elimination of NSF fees. BMO Harris, newly added to this analysis this year due to its acquisition of Bank of the West, saw a 65% decline since 2019, likely reflecting the reduction of its overdraft fee to $15 and the elimination of NSF fees.9 Huntington and KeyBank’s revenues fell 64% and 56% since 2019, respectively; Huntington reduced its overdraft fee to $15, among other changes, while KeyBank reduced its overdraft fee to $20, among other changes; both banks eliminated NSF fees. Citizens’ fees dropped 54% since 2019; it began offering a grace period until the end of the next day and eliminated NSF fees, among other changes. First National Bank Texas/First Convenience Bank, Arvest, and Woodforest experienced smaller declines since 2019 ranging from 21-23%. Among other changes, First National Bank Texas/First Convenience Bank implemented a grace period until the end of the next business day, while Arvest and Woodforest eliminated NSF fees. Fifth Third experienced the smallest decline since 2019 at 16%.
For the first time, we are also presenting the change in overdraft/NSF revenue at the individual bank level for the banks that reported between $10 million and $50 million in overdraft/NSF revenue in 2021, reflected in Table 3 below. We find that banks in this group reported 33% less overdraft/NSF revenue in 2023 than they did in 2019, a reduction of nearly $400 million. Of the 47 banks in this group, 41 reduced overdraft/NSF fee revenue, and the median bank reduced such fees by 29%. Of banks that increased overdraft/NSF fee revenue, the median increase was 8%.
Table 3: Change in overdraft/NSF fee revenue for the year 2023 versus 2019 for banks that earned between $10 and $50 million in overdraft/NSF fee revenue in 2021
| Bank | Assets ($B) 2023 | OD/NSF Rev. ($M) 2023 | OD/NSF Rev. ($M) 2019 | $ Change 2023 vs. 2019 | % Change 2023 vs. 2019 |
|---|---|---|---|---|---|
First Horizon Bank |
$81.40 |
$51.40 |
$59.30 |
-$7.90 |
-13% |
Frost Bank |
51 |
36.9 |
36.9 |
- |
0% |
Southstate Bank |
44.9 |
33.2 |
41.8 |
-8.6 |
-21% |
Hancock Whitney Bank |
35.6 |
27.6 |
35.8 |
-8.1 |
-23% |
Glacier Bank |
27.7 |
25.3 |
24.2 |
1 |
4% |
Gate City Bank |
3.5 |
25.1 |
22.6 |
2.4 |
11% |
Simmons Bank |
27.3 |
23.7 |
25.2 |
-1.5 |
-6% |
First National Bank of Pennsylvania |
46 |
24 |
42.9 |
-18.9 |
-44% |
Bancfirst |
10.5 |
23.4 |
27.8 |
-4.4 |
-16% |
Prosperity Bank |
38.6 |
23.2 |
28.3 |
-5.2 |
-18% |
First-Citizens Bank and Trust Company |
213.6 |
21.6 |
51.5 |
-29.9 |
-58% |
City National Bank of West Virginia |
6.1 |
21.5 |
24.8 |
-3.2 |
-13% |
Trustmark |
18.7 |
21.3 |
23.7 |
-2.4 |
-10% |
BOKF |
49.6 |
20.9 |
35.3 |
-14.4 |
-41% |
International Bank of Commerce (TX) |
9 |
20.4 |
30.5 |
-10.1 |
-33% |
The Central Trust Bank |
19 |
20.3 |
14.6 |
5.7 |
39% |
Old National Bank |
48.8 |
19.5 |
31.3 |
-11.8 |
-38% |
Webster Bank |
74.9 |
18 |
20.4 |
-2.3 |
-11% |
Academy Bank |
2.6 |
13.4 |
29.4 |
-15.9 |
-54% |
Community Bank, N.A. |
15.3 |
17.5 |
23.1 |
-5.6 |
-24% |
Zions |
87.2 |
17.3 |
28 |
-10.7 |
-38% |
Cadence Bank |
48.9 |
19.9 |
34.9 |
-15 |
-43% |
Northwest Bank (PA) |
14.5 |
16.7 |
16.2 |
0.5 |
3% |
Bankplus |
7.6 |
16.6 |
23.5 |
-6.9 |
-29% |
Umpqua Bank |
52.2 |
16.4 |
22.9 |
-6.5 |
-28% |
Santander |
100.5 |
18.5 |
65.6 |
-47.1 |
-72% |
Firstbank (CO) |
28.1 |
15.8 |
26.5 |
-10.7 |
-40% |
Renasant Bank |
17.4 |
15.3 |
17.6 |
-2.4 |
-14% |
Bank OZK |
34.2 |
15.2 |
16.3 |
-1.1 |
-7% |
Bank of Hawaii |
23.1 |
14.8 |
13.7 |
1.1 |
8% |
Comerica Bank |
85.5 |
14 |
21 |
-7 |
-33% |
Atlantic Union Bank |
21.1 |
13.3 |
17.7 |
-4.4 |
-25% |
Synovus Bank |
59.7 |
13.5 |
29.3 |
-15.9 |
-54% |
Armed Forces Bank |
1.3 |
9.4 |
16 |
-6.6 |
-41% |
First Hawaiian Bank |
24.3 |
12.2 |
14.5 |
-2.4 |
-17% |
First United Bank and Trust Company |
16.3 |
12.1 |
13.2 |
-1.1 |
-8% |
Associated Bank |
41 |
12.2 |
24.7 |
-12.4 |
-50% |
Fulton Bank |
27.4 |
11.4 |
17.9 |
-6.5 |
-36% |
Rockland Trust Company |
19.4 |
11.1 |
12.4 |
-1.3 |
-10% |
Commerce Bank |
31.5 |
10.3 |
27.7 |
-17.4 |
-63% |
Ameris Bank |
25.1 |
10 |
16.7 |
-6.7 |
-40% |
First Financial Bank (OH) |
17.5 |
8.9 |
19.9 |
-11.1 |
-56% |
Midfirst Bank |
36.7 |
8.3 |
12.2 |
-3.8 |
-31% |
United Bank (VA) |
29.9 |
6.3 |
14.9 |
-8.6 |
-58% |
New York Community Bank |
114 |
5.8 |
19.7 |
-13.9 |
-71% |
Banco Popular de Puerto Rico |
56.4 |
2 |
21 |
-19 |
-90% |
First Interstate Bank |
30.6 |
2.1 |
23.2 |
-21.2 |
-91% |
Total |
$1,875 |
$818 |
$1,217 |
-$399 |
-33% |
Other Listed (Maintenance and ATM) Fee Revenue
We also continue to examine other checking account fee revenue, in part to determine whether these fees may be increasing to replace reduced overdraft/NSF revenue. Call Reports require banks to list consumer deposit account revenue from three sources: 1) combined overdraft and NSF fees, 2) periodic maintenance fees, and 3) ATM fees. We refer to these three types of fees as “listed fees.” In Table 4 (structured similarly to Table 1), we report changes in listed fees other than overdraft/NSF fees – i.e., maintenance and ATM fees. As with prior analyses, we do not identify a clear relationship between declines in overdraft/NSF fee revenue and increases in other listed fee revenue.
Table 4: Change in other listed fee revenue (maintenance fees and ATM fees) for the year 2023 versus 2019 for select individual banks and groups of banks10
| Bank or Group | Number of Banks | Group Revenue ($M) Year 2023 | Group Revenue ($M)Year 2019 | $ Change 2023 vs. 2019 | % Change 2023 vs. 2019 |
|---|---|---|---|---|---|
Bank of America |
- |
$1,337 |
$1,467 |
-$130 |
-9% |
JPMorgan Chase |
- |
1,138 |
928 |
210 |
23% |
Wells Fargo |
- |
863 |
884 |
-21 |
-2% |
TD Bank |
- |
359 |
302 |
56 |
19% |
PNC |
- |
261 |
186 |
74 |
40% |
Truist |
- |
186 |
206 |
-20 |
-10% |
U.S. Bank |
- |
185 |
242 |
-57 |
-23% |
Regions |
- |
106 |
108 |
-2 |
-2% |
Total of select individual banks |
8 |
$4,434 |
$4,323 |
$111 |
3% |
$50m to $200m |
12 |
620 |
718 |
-98 |
-14% |
$10m to $50m |
47 |
481 |
507 |
-27 |
-5% |
$2m to $10m |
140 |
313 |
262 |
50 |
19% |
Under $2m |
410 |
192 |
181 |
11 |
6% |
Total |
617 |
$6,039 |
$5,992 |
$48 |
1% |
Among the eight larger individual banks, compared to the pre-pandemic 2019 baseline, there was a divergence of experiences in other listed fee revenue. However, there is no clear relationship between decreases in overdraft/NSF fee revenue and increases in other listed fee revenue. Of the four banks with the most significant percentage declines in overdraft/NSF fee revenue, Bank of America’s other listed fee revenue dropped 9%, while TD Bank’s increased 19%, Truist’s fell 10%, and U.S. Bank’s decreased 23%. In terms of dollar amounts, the declines in overdraft/NSF fee revenue across all eight banks in 2023 ($4.6 billion) far exceeded the net increase in other listed fee revenue ($111 million) since 2019.
Banks with $50-$200 million and banks with $10-$50 million in 2021 overdraft/NSF revenue, on average, reported less revenue from other listed fees in 2023 than before the pandemic; in contrast, banks with $2-$10 million and under $2 million in 2021 overdraft/NSF revenue saw increases. Across all reporting banks, other listed fee revenue remained flat from 2019 to 2023, even as overdraft/NSF fee revenue decreased by $6.1 billion.11
The CFPB’s focus on overdraft and NSF fees continues. The CFPB has proposed a rulemaking intended to ensure that overdraft offered by financial institutions with more than $10 billion in assets either operates as a courtesy or complies with regulations that apply to other consumer credit transactions. The CFPB has also proposed a rulemaking to prohibit NSF fees on transactions that are declined instantaneously or near-instantaneously.
The CFPB will also continue to follow trends in other listed fees.
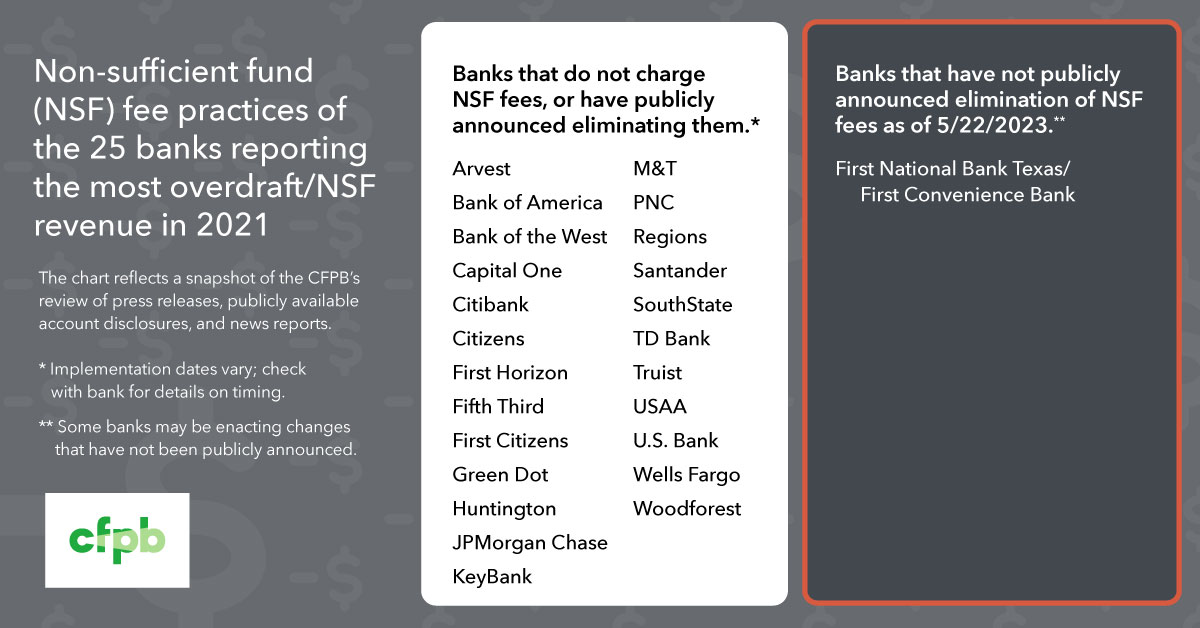
For our latest review of overdraft/NSF policies, please see the most recent table tracking overdraft fees and policies across banks and the most recent chart on NSF fee practices. For further discussion of trends in these practices, see our February 2022 analysis, April 2022 analysis, July 2022 analysis, February 2023 analysis, May 2023 analysis, and October 2023 analysis.
Endnotes
- Surveys prior to the pandemic found that approximately 25% of households overdrew their checking account, which amounts to roughly 33 million households. $6.1 billion in reduced fees divided by 33 million households equals $185 per household per year. Overdraft and NSF fees are not evenly distributed across households that overdraft, however. CFPB has previously found that nearly 80% of combined overdraft and NSF fees were shouldered by under 9% of accountholders who had more than 10 overdrafts annually. Thus, many households that have typically incurred a high number of overdraft or NSF fees have saved more than the average savings per household.
- The additional more than $120 million reflects approximately $79 million in unfair unanticipated overdraft fees charged on transactions that were authorized when the consumer had sufficient funds, and approximately $42 million in NSF fees charged on the same transaction that already incurred an NSF fee when it was previously declined.
- This revenue excludes overdraft/NSF revenue generated by banks with assets of $1 billion or less, which are not required to report overdraft/NSF fee revenue as a separate line item in their call report data, as well as overdraft/NSF revenue generated by all credit unions. Because some banks do not report in all years, some of the year-to-year variation in overdraft revenue reflects changes in the set of reporting banks.
- JPMC Institute, Household Pulse: The State of Cash Balances through March 2023.
- Some banks report fee revenue values for some quarters and not others. Most commonly, this occurs because banks with assets less than $5 billion are required to break out overdraft/NSF (and other listed fee) revenue only annually, not quarterly. Thus, some banks report all of their annual overdraft/NSF (and other listed fee) revenue in the fourth quarter. To estimate quarterly revenue with the benefit of the full year’s data, we allocate the annual reporters’ revenue to each quarter evenly, by applying one-fourth of it to each quarter.
- We define two groups of small banks, those collecting under $2 million and those collecting $2 million to $10 million in overdraft/NSF fee revenue in 2021, and two groups of midsized banks, those collecting $10 million to $50 million and those collecting $50 million to $200 million in overdraft/NSF fee revenue in 2021. Since our focus is exclusively on fee revenues, we use this categorization as opposed to the more common categorization by asset size. This is because overdraft/NSF revenue and asset size are strongly but not perfectly correlated. This means that some banks that are categorized as midsize banks here based on their overdraft/NSF revenue may not be midsize based on their assets. Conversely, some banks that are categorized as small banks here based on their overdraft/NSF revenue may not be small based on their assets.
- The data construction for Table 1 is the same as in our Dec 2021 report; please see that report for details. The table restricts data to banks that reported listed fees during 2023.
- It is important to note that there are significant drivers of fee revenues besides bank overdraft program settings. An important one is the number of accounts consumers hold at a bank. While we merger-adjust the data, there can be significant changes in the number of accounts held at a bank even without mergers. We cannot examine this further since Call Reports do not require banks to report the number of consumer checking accounts they hold.
- In order to construct a consistent set of banks over time, all institutions in this report are merged to the entity that was listed as the owner as of December 31, 2023, after mergers and acquisitions. As a result, some historical figures may not correspond to prior reports. See “Merger Adjusting Bank Data: A Primer ,” FDIC Quarterly 2018 Volume 13, Number 1.
- The data construction for Table 4 is the same as in our Dec 2021 report; please see that report for details. The table restricts data to banks that reported listed fees during 2023.
- We also note that, as with overdraft/NSF fee revenue, there are a number of factors that could influence other listed fee revenues, making it difficult to isolate the impacts of any policy changes, or lack thereof, without further analysis. For example, the increases in savings, such as those observed during the pandemic, can lead to higher average account balances, which can result in fewer accounts being assessed minimum balance maintenance fees. Other factors, including growth in the number of accounts, would have the opposite effect.