Office of Research Blog: Even as rents increase, fewer people are buying
The past two years of high inflation have been difficult for renters. In our recent report, Making Ends Meet in 2022, we found that nearly one third of renters did not pay or were late with the rent at least once in the last year. As we discussed in a previous blog post in this series, housing is a large share of overall expenditures and housing inflation has been a big part of recent inflation. Rents have increased rapidly in many areas. At the same time, the cost of buying a home has increased, pricing out many potential homebuyers.
In this blog post, we begin with the challenges of high rent inflation and ask whether renters who missed payments were able to take advantage of pandemic-related rental assistance. We then discuss rates of transition into homeownership—which can protect consumers from rising rents—and how they differ by race and ethnicity. And we conclude with some of the drawbacks and potential risks of homeownership, especially in situations where housing values may fall.
Rent inflation has been both high and widespread over the past two years
Rent increases have been widespread over the last two years, affecting people across the rental housing market. For example, Figure 1 shows the percentage increase in the Zillow Observed Rent Index from October 2020 to October 2022. The index measures the change in how much landlords charge for the same unit between current and previous listings, and is weighted to be representative of the entire rental market. We plot the percentage increase in the index in each county where Zillow calculates it and compare the change to the percentage of the county’s population who are Black or Hispanic.
Figure 1: Percent of county population that is Hispanic or Black and rent price growth across counties from October 2020 to October 2022.
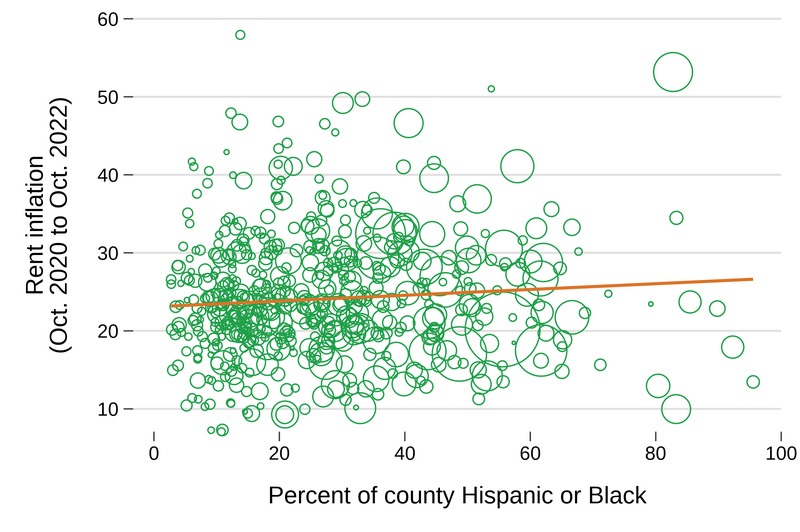
Source: Authors’ calculations from the Zillow Observed Rent Index and 2020 Census. Rents increased rapidly over the last two years, but not significantly faster in high Hispanic or Black areas. Markers weighted by population size. The best fit line is weighted.
While some counties had much higher increases than others, there was no strong relationship between the racial and ethnic composition of a county and rent price growth. The line illustrates a slight upward relationship, but that relationship is neither statistically nor economically significant. (The picture does not change much if we break out Hispanic and Black consumers separately or use different time periods to measure rent increases.)
What is striking about the figure is that rent price growth was, on average, about 26 percent for the two years from October 2020 to October 2022. The Zillow index measures changes in what landlords charge for listed units (and not changes in rents for people who renew their leases), so not all renters experienced such a large increase. But because housing is such a large percentage of a typical household’s budget monthly budget, even smaller upticks can place considerable stress on a family’s finances.
Renters who missed payments were not very likely to receive assistance, but many recovered on their own
One of the startling findings from our recent report was that, in this environment of general rent inflation, nearly one third (31 percent) of renters missed or delayed a payment in the year prior to the February 2022 Making Ends Meet survey. During the pandemic, many forms of assistance were made available to renters. How many of those who missed payments actually received assistance?
Figure 2 shows that less than 20 percent of renters who missed at least one payment received any sort of assistance, from payment flexibility, eviction protection, or direct rental assistance. The survey question asked about “coronavirus-specific” assistance, so it is possible more renters received assistance that was not related to the COVID-19 pandemic.
Figure 2: Percentage of renters who missed or were late with a payment who reported receiving assistance.
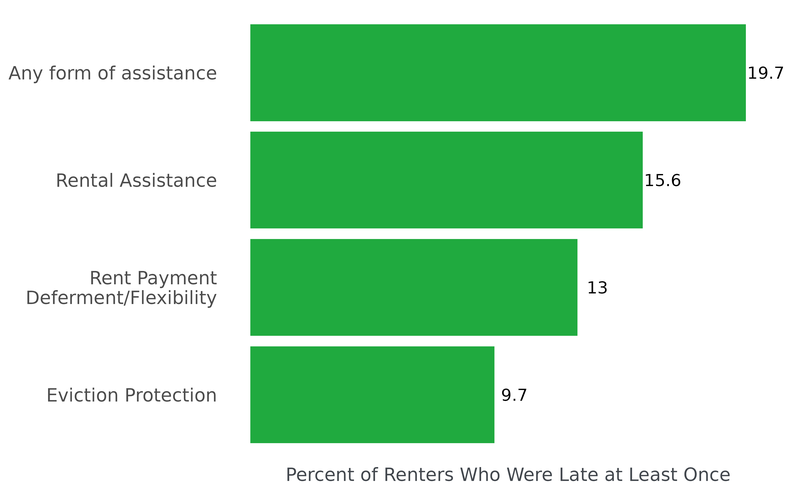
Source: Authors’ calculations from the Making Ends Meet survey. Renters who missed or were late with a payment generally did not find much assistance in 2021 and early 2022.
While these pandemic programs likely supported millions of renters, they did not reach many millions more. Many renters who missed payments were able to catch up without them. While 31 percent were late at least once over the year before the survey, only 8.4 percent were not current at the time they responded to the survey. Of course, the 69 percent of renters who were able to make all payments have had to find ways to adapt as well. While rent price increases have slowed recently, they have still been high and, as Figure 1 shows, widespread. As previous Making Ends Meet reports have pointed out, when people experience large unexpected expense shocks—such as paying a lot more for rent—it can make it hard for them to pay for other things as well, including food, utilities, and medicine, and can cause them to default or not pay other bills or debts.
During the pandemic, white renters were more likely to avoid widespread rent inflation through homeownership
Buying a house can protect homeowners against rent increases , because, with a fixed-rate mortgage, an important part of the nominal cost of housing stays constant over time. During the previous 30 years of low inflation, homeownership protected against rent increases affecting a particular individual or area: It was always possible an individual landlord might decide to convert a unit into a condo. Or perhaps a particular area might suddenly become more desirable, so landlords in that area raise rents. For most homeowners, an area becoming more popular does not affect their mortgage. But for renters, such changes may end up making housing unaffordable.
During the pandemic, however, purchasing a home may have protected former renters from the more universal impact of rapid rental inflation. In Figure 3, we show the percentage of households that were not homeowners at the time of our three most recent surveys who have since acquired a mortgage. We then measure the transition into homeownership by whether the survey respondent got a mortgage in our credit bureau data over the next several years. (A small group may have bought outright without getting a mortgage.) The x-axis of each plot shows the months since the December closest to each survey. We start in December each year to hold seasonal differences constant. Each plot shows whether a mortgage was acquired through September 2022. For more recent surveys, we observe the survey respondents for less time after the survey, so the corresponding plots are shorter.
Figure 3: Percentage of non-homeowners transitioning into homeownership for three cohorts, starting in December 2019, 2020, and 2021.
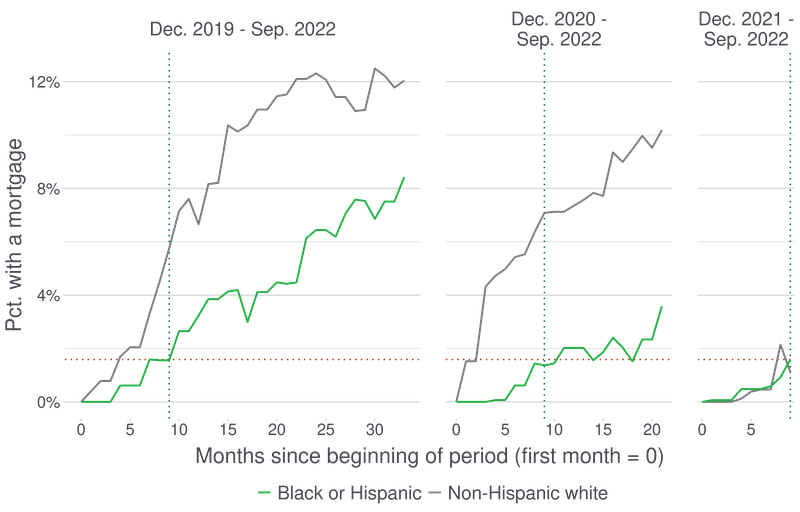
Source: Authors’ calculations from the Making Ends Meet survey and Consumer Credit Panel. Despite low interest rates, Black and Hispanic families were less likely than non-Hispanic white families to transition into homeownership during the pandemic. We use mortgage acquisition as our measure for transition into homeownership, which was slower for everyone in 2022. Each panel includes survey respondents who did not own a home or have a mortgage on their credit record in the survey closest to December 2019, December 2020, or December 2021.
Ten months following both December 2019 and December 2020 (denoted by blue dotted lines for comparison across periods), around seven percent of non-Hispanic white consumers who did not own a home had acquired a mortgage, compared to less than two percent of Black or Hispanic consumers. This gap persists for at least two years. Some explanations for the gap might include lower wealth, lower income, and, as our recent report showed, a large gap in access to credit.
Interest rates were historically low during the pandemic through approximately December 2021. Figure 3 shows that non-Hispanic white families were better able to take advantage of these low rates and buy than Hispanic or Black families. As home prices increased, existing homeowners—who are more likely to be non-Hispanic white—received a massive increase in housing wealth . Since then, continuing renters were exposed to rapid rent increases in most markets.
But the sharp rise in mortgage rates starting in December 2021 and home prices in many markets over the last two years have made it much more expensive to buy than two years ago. Another recent post in this series calculated that the average monthly mortgage payment for a new mortgage increased by 35.6 percent from December 2021 to June 2022, driven almost entirely by higher interest rates. The median house price increased from $337,500 in the third quarter of 2020 to $454,900 in the third quarter of 2022, a 35 percent increase.
The combination of rising interest rates and elevated home prices is a double hit for non-owners seeking to buy. And 10 months after December 2021, less than 2 percent of non-Hispanic white, Black, and Hispanic non-owners had a mortgage (denoted by red dotted lines for comparison across periods). Rising interest rates made it more difficult even for non-Hispanic white households to transition out of renting, even as rents were rising rapidly.
Purchasing during the pandemic may have meant buying at the top of the housing market
Of course, home ownership also has risks. The increase in home prices over the last several years means that most people who bought before interest rates started rising have had their homes appreciate in value. But increases in home prices can also mean higher property taxes. And maintenance and utility costs—which tend to be higher for homeowners—are also subject to inflation.
In addition, home prices don’t inevitably go up. Despite recent declines in some markets, home prices are still very high compared to incomes. But as we saw in the 2008 financial crisis, buying into a booming housing market can expose households to large declines in wealth if home prices fall. House prices have started to fall in some markets in recent months, although they are still generally higher than two years ago.
Home price increases have slowed or even reversed in recent months. At the same time, the growth rate for rents has slowed since June 2022 and the national rent index actually declined slightly in October and November 2022 . But rents, home prices, and mortgage interest rates are still much higher than they were several years ago. Understanding how people adapt to declining housing affordability is an important area for continuing study.
The views expressed here are those of the authors and do not necessarily reflect the views of the Consumer Financial Protection Bureau. Links or citations in this post do not constitute an endorsement by the Bureau.