Medical Billing and Collections Among Older Americans
By the CFPB Office for Older Americans – MAY 30, 2023
Contact the Office for Older Americans: olderamericans@cfpb.gov
Executive Summary
Older adults, most of whom have health insurance coverage, are among the millions of Americans who experience problems with reporting and collection of inaccurate medical bills. This spotlight describes how medical billing practices can lead to inaccurate bills and attempts to collect amounts that are not owed from people 65 and older.1 It also describes the impact of inaccurate medical bills, including coercive credit reporting on older adults. The spotlight uses the most recent data from the Census Bureau’s Survey of Income and Program Participation (SIPP),2 and consumer complaints submitted to the CFPB between January 2020 and December 2022.3
Key findings:
- In 2020, nearly four million adults ages 65 and older reported having unpaid medical bills, even though 98 percent of them had health insurance coverage. Nearly 70 percent of these older adults with unpaid medical bills also reported having medical insurance coverage from two or more sources.
- The reported amount of unpaid medical bills among older adults increased by 20 percent between 2019 and 2020, from $44.8 billion to $53.8 billion. Yet older adults reported fewer doctor visits and lower out-of-pocket expenses in 2020 than in 2019.
- Older adults face a complex billing system with a high likelihood of errors and inaccurate bills. Complaints submitted to the CFPB involving Medicare commonly cite inaccurate billing as a source of unpaid medical bills in collections. Consumers who reported having multiple sources of insurance were especially likely to note problems with inaccurate billing.
- Millions of older adults ages 65 and older are covered by Medicare and Medicaid. These individuals are known as dually eligible beneficiaries. Most dually eligible beneficiaries should have little or no out-of-pocket costs for Medicare-covered care. Federal and state laws prohibit providers from billing certain dually eligible beneficiaries for payment beyond a nominal copay set by the state, if any. Despite these protections, older adults with both Medicare and Medicaid are more likely to report unpaid medical bills than the general older population. CFPB findings suggest that providers are billing older dual beneficiaries for amounts they don’t owe.
- Providers and billers refer inaccurate medical bills to collectors and credit reporting companies with significant consequences for the health and financial security of older adults. In CFPB credit reporting complaints, for example, older adults describe how inaccurate medical tradelines on their credit reports have affected their access to affordable credit. Older adults also report that trying to address inaccurate bills that are now in collection and appearing in their credit reports takes a significant emotional and physical toll.
- The medical billing and collection system devotes insufficient resources to preventing, identifying, and correcting errors. Older adults may find it especially challenging to navigate the medical billing system and resolve errors because they are more likely than other consumers to experience functional limitations that reduce their ability to detect and correct inaccurate bills.
Introduction
Older adults, most of whom have health insurance coverage, are among the millions of Americans who experience problems with reporting and collection of inaccurate medical bills. In 2020, nearly four million adults ages 65 and older reported having $53.8 billion in medical bills that they were unable to pay in full, even though 98 percent of them had health insurance coverage.4 Nearly 70 percent of these older adults with unpaid medical bills also reported having medical insurance coverage from two or more sources such as Medicare, Medicare Advantage, Medicaid, Medigap, employer-based coverage, or Tricare.5 Additional sources help protect older adults from medical expenses by covering services Medicare does not broadly cover, such as hearing, vision, or dental care, and/or reducing eliminating out-of-pocket costs.6
A number of factors can contribute to unpaid medical bills and medical debt among people with health insurance. These factors include out-of-network charges, deductibles and other cost-sharing, services that are not covered by Medicare, frequent and complex medical care, limited income, and medical billing errors.7 The persistence of unpaid medical bills, even among older adults with more comprehensive insurance coverage, is at least in part the result of inaccurate bills. Inaccurate bills, as noted in prior CFPB work, are referred to debt collectors and reported to credit bureaus with many consequences for access to credit, housing, and employment.8 Prior CFPB work and other studies have also documented the high complexity of the medical billing system and the effort required from consumers to navigate the medical billing system and correct errors.9
Older adults are more likely than adults ages 18 to 64 to rely on multiple payers. They are also more likely to live with multiple chronic health conditions that require frequent medical visits10 and complex care.11 Additionally, older adults are also more likely than adults ages 18 to 64 to experience functional limitations that reduce their ability to detect and correct inaccurate bills.12 As a result, they may be more likely to experience errors and inaccurate medical bills, and the challenges associated with credit reporting and collections on such inaccurate debts may affect them disproportionately.
This spotlight describes how medical billing practices can lead to inaccurate bills and debts not owed for people 65 and older. It also describes the impact of inaccurate medical bills, including coercive credit reporting on older adults. The spotlight relies primarily on the most recent data from the 2021 Survey of Income and Program Participation (SIPP), a nationally representative survey of U.S. households with a sample of 13,300 adults ages 65 and older, conducted by the U.S. Census Bureau between February 2020 and June 2021.13 It also relies on complaints submitted by consumers to CFPB between January 2020 and December 2022, including approximately 1,100 debt collection complaints and more than 300 credit reporting complaints about Medicare billing.14 Consumer complaints provide insights into how inaccurate bills reach debt collectors and credit reporting companies, the challenges that consumers face when they attempt to fix incorrect medical bills, and the impact of inaccurate medical bills on older adults.
Older adults report having unpaid medical bills despite many having comprehensive medical insurance
In 2020, 7 percent—or 3.9 million—adults ages 65 and older reported having unpaid medical bills according to CFPB’s analysis of SIPP.15 Some subgroups of older adults are more likely than the average older adult to report unpaid medical bills. They include older adults of color (12 percent), older adults with annual household incomes between 100 and 200 percent of the federal poverty level (13 percent),16 older adults with poor or fair health (13 percent), and older adults carrying other debts such as mortgages, student loans, and credit card debt (10 percent).17 In general, the percentage of older adults reporting unpaid medical bills was lower than the percentage of adults ages 18 to 64 (11 percent) reporting unpaid medical bills. That figure may be in part due to the nearly universal health insurance coverage among older adults, most commonly provided through Medicare.18 Health insurance provides important protections against medical debt by reducing out-of-pocket expenses, among other things.19
The amount of unpaid medical bills is also increasing among older adults. The total amount of unpaid medical bills reported by older adults increased by 20 percent between 2019 and 2020, from $44.8 billion to $53.8 billion.20 The average and median amounts in unpaid medical bills reported by older adults were also higher in 2020 ($13,800 average / $1,500 median) than in 2019 ($11,700 average /$1,200 median).21 These increases are higher than the growth in Medicare premiums, and greater than overall Medicare and health spending observed between 2019 and 2020.22 They are also surprising given that older adults who reported unpaid bills in the survey also reported fewer doctor visits and lower out-of-pocket expenses in 2020 than in 2019.23 Lastly, the amount of unpaid bills has increased among older adults despite notable recent improvements in the health of older adults with Medicare,24 and the reduction of Medicare coverage gaps for older adults and enhanced assistance programs for low-income beneficiaries over the last 20 years.25
FIGURE 1:
Older adults’ unpaid medical bills by insurance coverage, December 2020

Source: CFPB analysis of the Census Bureau, Survey of Income and Program Particiption 2021, public use files.
Older adults with insurance coverage account for an increasing proportion of the unpaid bills. While reporting unpaid medical bills is more common among the uninsured (13 percent) and those with Medicare-only coverage (11 percent) or other single source of insurance (13 percent), reports of unpaid medical bills persist even among those older adults with more comprehensive coverage provided either through managed care Medicare Advantage plans or an additional source of health insurance coverage such as Tricare, Medigap plans, employer-based coverage, and Medicaid.26 These sources help protect older adults from medical expenses by closing Medicare coverage gaps such as hearing, vision, or dental care, and/or reducing or eliminating out-of-pocket costs.27 These sources also provide additional coverage to approximately 80 percent of Medicare beneficiaries.28
Overall, 6 percent of older adults with an additional source of insurance coverage report unpaid medical bills, but the percentage varies for those with supplemental coverage provided through employers or former employers (4 percent), Medicaid (10 percent), or Tricare (8 percent).29 Among older adults in Medicare Advantage, 7 percent report unpaid medical bills.30 Older adults with additional coverage from these sources account for nearly 70 percent of older adults reporting unpaid medical bills in 2020.31
FIGURE 2
Percentage of older adults reporting unpaid medical bills by selected sources of coverage, December 2020
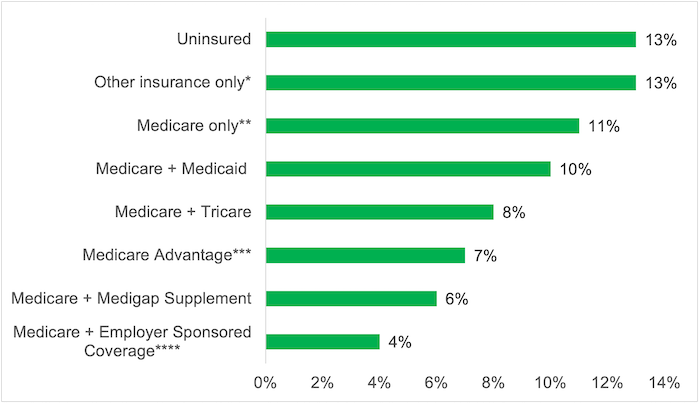
Source: CFPB analysis of the Census Bureau, Survey of Income and Program Participation 2021, public use files.
Notes:
*Other sources refer to insurance provided by a single source or multiple sources, excluding Medicare (e.g. Medicaid only, Tricare only).
** Medicare only refers to beneficiaries with Part A or Parts A and B only.
*** Due to self-reporting biases, the percentage of older adults covered by Medicare Advantage plans is likely to exclude beneficiaries who have employer sponsored coverage or Medicaid coverage through Medicare Advantage plans.
**** Employer sponsored includes retiree coverage and coverage for older adults currently employed.
The persistence of unpaid medical bills among older adults with more comprehensive insurance coverage is at least in part the result of inaccurate bills.32 Studies have found that erroneous insurance claims commonly result in inaccurate bills for patients with insurance.33 Common errors—such as missing or invalid claim data, authorization and pre-certification issues, missing medical documentation, incorrect billing codes, and untimely filing—contribute to the rejection of claims that would otherwise be paid.34 Many of these errors likely are avoidable or fixable,35 but only a fraction of rejected claims are adjusted and resubmitted.36 A 2022 survey found that 68 percent of adults with unpaid medical bills in the past five years reported that they did not pay the medical bill in full or only partially paid it because they thought their insurance was covering it. According to the survey, 44 percent of adults reported that they did not pay the medical bill in full or only partially paid it because they were not sure if the medical bill was accurate.37
Older adults face a complex billing system with a high likelihood of errors and inaccurate bills
While inaccurate medical billing and the burden of addressing inaccurate bills affect consumers of all ages, two factors increase the chances of errors and inaccurate bills for older adults.
First, older adults are more likely than younger adults to have multiple chronic health conditions38 that require complex medical care.39 Providers use “higher-intensity” medical billing codes to seek reimbursement for higher-level care.40 These billing codes provide for larger payments, but they also require detailed documentation.41 Medical claims using these codes are facing greater scrutiny from insurers due to concerns about upcoding42 and overuse.43 These factors are commonly associated with billing errors and claim denials.
Second, older adults are also more likely to rely on multiple insurance plans to cover their medical services, compared to adults ages 18 to 64. In 2020, 68 percent of older adults with unpaid medical bills were covered by two or more sources of insurance, compared to 11 percent of adults ages 18 to 64 with unpaid medical bills.44 Studies have found that having multiple insurers increases the complexity of the billing process.45
In cases involving multiple payers, Medicare relies on coordination agreements that allow claims to be shared and transmitted to multiple insurers simultaneously.46 The transmission of claims between Medicare and other insurers is known as the crossover process.47 The submission of accurate claims is particularly important because the crossover process does not necessarily fix breakdowns in communication between insurers and providers, or resolve data conflicts.48 To further complicate the billing system, some insurers, including state Medicaid agencies, require certain claims to be filed directly with them instead of relying on the crossover process.49 When providers fail to file directly with these insurers, this inaction results in unpaid bills.
Lastly, when multiple insurers are involved, each insurer sets a different reimbursement rate or discount. This limits the amounts that providers receive from insurers and/or can collect from beneficiaries.50 Yet some providers wrongfully demand payment for the difference between their bill and the contractual reimbursement rate or discount, in addition to allowable coinsurance, copayments, and deductibles.51
CFPB debt collection complaints involving Medicare show that inaccurate billing is a common issue, especially for consumers who rely on more than one insurance source. In 53 percent of these complaints, people with Medicare reported that the underlying debt was inaccurate. For people with more than one source of insurance, the proportion was 61 percent.52
FIGURE 3
Issues reported in medical debt collection complaints related to Medicare, January 2020 – December 2022
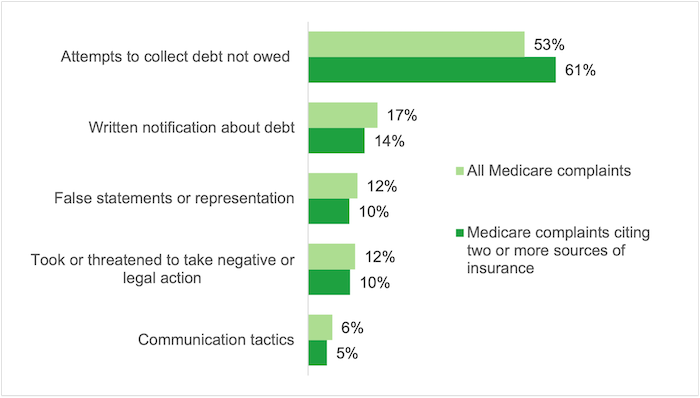
Source: CFPB Consumer Complaints
The complaints describe in detail issues that lead to inaccurate and erroneous billing for people with multiple sources of insurance. For example, some complaints report that providers never billed a secondary insurer such as Medicaid or Tricare.
All of these charges were brought about during my [cancer] treatment. [The hospital] neglected to use my Medicaid insurance along with my Medicare insurance which they have copies of both. I did not receive mailed statements for services rendered and also had no copays for these amounts. As of this writing they still do not do proper insurance billing as it is faster for them to send to [the debt collection company].53
Many consumers report that the underlying debt was the result of the provider’s attempt to bill consumers for amounts beyond the contractual reimbursement rate:
I took a medical test at my specialist’s office two years ago. The charges were covered by my insurance and the specialist’s health system is a “preferred provider." They are required to accept this amount as payment in full. I paid the patient portion in full. The doctor's office has attempted to collect an additional $XXX from me that I do not owe. I have received numerous calls and letters from them, their billers, and an outside collections agency. Each time, I have submitted letters disputing the validity of this debt and provided them with copies of my Explanation of Benefits, which clearly states that I am not responsible for any additional amounts. This has been going on for nearly two years and I am suffering a great deal of stress and anxiety because of the ongoing dispute.54
Older people with both Medicare and Medicaid report high levels of unpaid medical bills despite numerous protections
Nearly 7 million older adults ages 65 and older are enrolled in both Medicare and Medicaid. They are known as dually eligible beneficiaries.55 Most dually eligible beneficiaries should have little or no out-of-pocket costs because they qualify and receive Medicaid assistance with Medicare premiums, coinsurance, copayments, and deductibles for Medicare-covered care.56 Similarly, a majority of dually eligible beneficiaries also receive help with the cost of hearing, dental, and vision care – costs that typically are not covered by traditional Medicare.57
In addition, federal and state laws prohibit providers from billing certain dually eligible beneficiaries58– who, together, account for nearly two-thirds of dual beneficiaries59 – for payment beyond a nominal copay, if any.60
The protections provided to dually eligible beneficiaries are vital, as the vast majority of these individuals have very low income and assets.61 In addition, older dually eligible beneficiaries are more likely than other older adults to report poor health, a wide range of chronic conditions, and limitations with activities of daily living than the general Medicare population age 65 and older.62
Despite these protections, older people with both Medicare and Medicaid are more likely to report unpaid medical bills than the general older population (10 percent vs. 7 percent).63 Furthermore, older dually eligible beneficiaries with unpaid medical bills report, on average, more in unpaid medical bills than the general older population ($15,700 vs. $13,800).64 Among other things,65 these findings suggest that providers are billing older dual beneficiaries for amounts they don’t owe.66
In 2019, the CFPB and Centers for Medicare & Medicaid Services jointly highlighted the illegal practice of billing certain dually eligible beneficiaries for additional amounts that are not owed.67 Unfortunately, dually eligible beneficiaries continue to experience the same inaccurate bills.
Complaints submitted to the CFPB by older dually eligible beneficiaries illustrate how inaccurate billing affects them:
In all the years I have been on Medicare and Medicaid I have never paid for a doctor's visit except for any copay that might be due which was about $3.50… I was billed again and contacted the billing department again and they said the doctor is refusing to update the notations so the right coding can be submitted to Medicare. Today I received a debt collection letter about this bill that should never have been from day one. [Please] file the correct claim with Medicare and…Medicaid to get the bill paid and to remove any negative marks and consumer statements from my profiles. [I want] to never be contacted by this debt collector again.68
In complaints submitted to the CFPB, some dual beneficiaries also report that their claims were never submitted to the state Medicaid agency for payment:
Medicaid was willing to pay for the debt when I first started to receive the bills in 2018. I called the doctors and explained that Medicaid wanted them to [file a claim]. [T]he doctors didn't want Medicaid, they wanted cash money[.] I explained I'm on a fixed income on SSI disability so I called Medicaid back. Medicaid said they can't do anything unless the doctors file a claim. So... the bills went to [a collection agency]. The amount at the time [was] $4900. I checked my credit history and the amount is now $5,130 dollars.69
Inaccurate medical bills that are referred to debt collectors and appear in consumer credit reports may have significant consequences for the health and financial security of older adults
Prior CFPB work has shown that some unpaid medical bills are sent to collectors and reported to credit reporting companies even if they are the result of wrongful billing.70 As of December 2020, the CFPB’s Consumer Credit Panel71 showed $7.97 billion in medical collection tradelines in the credit reports of 5.1 million older adults.72
When inaccurate medical bills are referred to debt collectors and appear in consumer credit reports, older adults experience negative impacts to their credit access and terms. Since some lenders, employers, insurers, landlords, and others still rely on outdated credit scoring models that include medical collections tradelines, incorrect data on medical debt can affect many aspects of the financial lives of older adults.73 As noted, older adults responsible for multiple debts, including mortgages, student loans, and credit card debt, are more likely to report having unpaid medical bills. In complaints related to credit reports, older adults describe how inaccurate medical debt is impacting their access to affordable credit and ability to borrow:
I've been on disability since birth with Medicaid and Medicare my entire life. I have always had a $0 copay. I've been in an ambulance more than once in my life, every other ambulance bill has been paid for in full by my insurance. I have submitted dispute after dispute to Equifax with no success. Now I am being denied every single application again and again. I believe [this bill] has been holding me back from being able to access any sort of relief loans or any line of credit going all the way back for the past 7 years.74
Medical debt can also have significant consequences for older adults’ health and well-being. Older adults with medical debt are more likely to forgo medications, skip doctor’s visits, or learn that healthcare providers refuse to treat them.75 For instance, according to the Federal Reserve Board Survey of Household Economic and Decision-making, 19 percent of older adults with medical debt responded by skipping doctor visits and 17 percent chose not to fill physician-prescribed medication.76 This reduced access to medical care can have devastating consequences if health conditions worsen or fail to improve due to lack of treatment.
Older adults face a challenging billing system that devotes insufficient resources to preventing, identifying, and correcting errors
The medical billing and collection system devotes insufficient resources to preventing, identifying, and correcting errors.77 Consumers trying to address the inaccurate bills are caught in a “doom loop.” This “doom loop” can lead patients to pay erroneous bills in order to make the problem “go away”78 and may be particularly common for people seeking credit to buy a house, car, or other major purchase.79
Complaints illustrate how difficult it is to identify an inaccurate bill, learn where it originated, and correct other people’s mistakes when consumers have no direct control over the billing and claims determination process. Some providers refuse to talk to consumers because the account has already been referred to collections. Even when providers seem willing to correct their own mistakes, debt collectors may continue attempting to collect a debt that is not owed and refuse to stop reporting inaccurate data:
I was transported to [hospital] from my home by [ambulance] company. On the way to hospital the billing information was given. Medicare plus a supplemental insurance. I never received a bill from anyone. On XX at XXXX p.m. I received a call from [a debt collection company]. The woman on the phone started off aggressively screaming at me that I owe them [$2300.00]. I told her there must be some mistake that both Medicare and my supplement insurance would have covered it. It has in the past. She started screaming very loud if you don't pay me right now I will put this on your credit report. I told her if you keep screaming at me I will hang up. She continued so I hung up [. . .] [Healthcare insurance company] advised me that the ambulance billing company never billed the invoice they held it then sent it on to collections, [ambulance] billing department. [Supervisor's name] XXXX. XXXX has been in constant contact with [the debt collection company]. [The debt collection company] has continued to refuse to remove the information from my credit report even after they have been told from both [healthcare insurance company] and the billing office the invoice has been paid. [Healthcare insurance staff] at my direction has been weekly contacting them to have it removed. As of today XX, it has not been removed.80
Ensuring that the charges are removed from all three of the national credit reporting companies adds further complexity and can be a major source of stress and anxiety for patients:
[Three years ago], I was admitted to the emergency department. Last year, I found 3 COLLECTIONS charges on my credit report. My insurer promised to take care of both sets of charges/payments. I disputed the charges online with two credit reporting companies but I never heard back. Last year, I checked my credit reports again, and all 3 charges were still there. The collection agency agreed to research it. By the end of that month, nothing had changed except that now there were 2 additional inaccurate charges from the same hospital stay. I spent 2 weeks on the phone trying to find out who was billing me and why. It nearly sent me back to the hospital with the tremendous stress it created.81
Medical debts often are transferred or sold, making it even more difficult for consumers to address inaccurate bills in collection and credit reporting tradelines. Consumers also report that this effort takes a significant emotional and physical toll:
I still have not received a bill from this collection agency, but the collection account appeared on my credit report a few months ago. As I stated previously, I immediately contacted the original provider. They told me to contact the collection agency, so I did. The collection agency did the same thing! They told me to contact the original provider, and that filing claims “wasn’t their problem.” When I contacted the hospital AGAIN, they told me they couldn’t file claims or accept payment once an account is sent to collections. That the collection agency could, in fact, file the insurance claim.
I want the claim filed with my insurance company asap! I also want this to be removed from my credit report with all three bureaus immediately! I would also greatly appreciate an apology for the immense stress this has put me under. Not only has this caused my debt to go up, but this also caused me to suffer ill-effects to my health! I’m disabled and stress causes [chronic illness] to flare up, which means I lose some of the use of my left leg and arm. It also causes me to suffer extreme nerve pain, severe fatigue, migraine headaches, and simple-partial seizures!82
Another consumer described the burden placed on consumers, and the resources and time needed to resolve the problems:
Hospital staff eventually promised to make sure that all of these charges were removed from my records. The collection agency said they would remove them once they received information from the hospital. I checked my credit reports a couple of months later only to discover ALL 5 charges had been sold to another collection agency! Recently I decided to pay the darn bills even though I don’t owe them. This has lowered my credit score for three full years. I have new more severe chronic illnesses now and medical testing appointments scheduled this month. I can’t imagine how many people have similar situations and never get them resolved because they don’t have the time, access or resources to pursue fairness. I feel like a tiny squeaky cog in a gigantic perpetual motion machine... Our medical system, health insurance system and financial reporting system are set up to ensure one or the other will kill me before any disease.83
The challenges of navigating the medical billing system and resolving errors are heightened for older adults due to the presence of functional limitations. In contrast to adults ages 18 to 64 with unpaid medical bills, older adults with unpaid medical bills are more likely to face functional limitations such as hearing, mobility, or vision impairments.84 Those limitations can interfere with their ability to address inaccurate medical bills and credit reporting problems. Functional limitations may also affect their ability to reach a healthcare provider, biller, insurer, debt collector, or credit reporting agency on the phone, online, or by mail.
In addition, older adults with medical debt have limited flexibility in their monthly budgets to pay for these errors, even if the amounts owed are small.85 For example, 52 percent of older adults with unpaid medical bills report living on fixed incomes that are equal to or lower than their expenses, compared to 41 percent of adults ages 18 to 64 with unpaid medical bills.86 These challenges are even greater for older adults with unpaid medical bills who are dual beneficiaries of Medicare and Medicaid, because they face greater income and functional limitations than other older adults and report higher rates of unpaid medical bills.
Conclusion
Consumers face a complex medical billing system where inaccurate and erroneous bills are common and resources to prevent and correct errors are limited. This issue spotlight describes how unpaid medical bills persist even among older adults with comprehensive health insurance and those who have the greatest protections against out-of-pocket expenses and balance billing.
Inaccurate medical bills are referred to debt collectors and appear in consumer credit reports, and the burden of resolving them often falls to consumers. Yet, the complexity of the current medical billing system and the issues that lead to inaccurate bills make it practically impossible for consumers to detect and resolve errors before they are reported to debt collectors. These challenges are greater for older adults, especially those who face functional limitations or live on a fixed income.
CFPB’s scrutiny of the accuracy of medical tradelines reported on consumers’ credit reports has already resulted in significant changes to consumer credit reporting and debt collectors’ practices.87 The recent decrease in medical tradelines listed on consumers’ credit reports suggests that debt collectors are beginning to recognize these data integrity issues.88 This decline may be explained partly by structural dysfunctions in medical billing and collections, which increase the risk that debt collectors will not meet their legal obligations and will therefore decide not to collect on these debts.89
This spotlight highlights the need for additional steps to prevent and address the harm and burden placed on older consumers due to inaccurate debts arising from erroneous medical billing.
Appendix A: Data and Methodology
To develop this report, the CFPB relied primarily upon original analysis of public use data from the U.S. Census Bureau Survey of Income and Program Participation (SIPP) and the Federal Reserve Board Board’s Survey of Household Economics and Decision-making (SHED), and complaints received by the CFPB. The report also leverages data and findings from other reports, studies, and sources, and cites to these sources accordingly. Readers should note that estimates drawn from survey data are subject to measurement error resulting, among other things, from reporting biases and question wording.
Survey of Income and Program Participation (SIPP)
The Survey of Income and Program Participation (SIPP) is a nationally representative survey of U.S. households conducted by the U.S. Census Bureau annually. The 2021 SIPP collected data from about 24,000 households (56,500 people) between February 2020 and June 2021. The CFPB’s analysis relied on public use data. To capture medical debt, the survey asked all respondents ages 15 and older: (variable EDEBT_MED) “Did you have any medical bills you were unable to pay in full? And a follow-up question: (variable TMED_AMT) “How much did you owe for medical bills you were unable to pay in full?” Respondents were asked to include bills for doctors, dentists, hospitals, therapists, medication, equipment, nursing home or home care, and exclude bills that will likely be paid by the insurance company or have been paid in full. The analysis reflects the weighted value of individual responses, and the amount in unpaid medical bills reported as of December 2020.
The public-use version of the survey dataset, and the survey documentation can be found at: https://www.census.gov/programs-surveys/sipp.html .
Appendix B: Percentage of older adults with unpaid medical bills and amounts reported by selected socio-demographic and financial factors, 2020
| Category | Sub-category | Percentage with unpaid medical bills | Mean amount of medical bill | Standard Deviation | Median amount of medical bill |
|---|---|---|---|---|---|
All older adults |
65 and older |
7% |
$13,800 |
$60,847 |
$1,200 |
Age group |
65 to 74 |
9% |
$14,300 |
$61,475 |
$1,400 |
Age group |
75 and older |
5% |
$12,300 |
$59,257 |
$1,000 |
Sex |
Male |
6% |
$17,100 |
$66,878 |
$2,000 |
Sex |
Female |
8% |
$11,600 |
$56,453 |
$1,000 |
Living in a metro area |
Yes |
7% |
$13,000 |
$58,562 |
$1,200 |
Living in a metro area |
No |
9% |
$14,000 |
$60,717 |
$1,600 |
Poverty level |
Income at or below 100% of the federal poverty line |
10% |
$20,000 |
$73,252 |
$1,000 |
Poverty level |
Between 101% and 199% |
13% |
$11,300 |
$52,621 |
$1,020 |
Poverty level |
200% or more |
6% |
$14,000 |
$62,426 |
$1,500 |
Self-reported health |
Good, Very Good or Excellent |
5% |
$9,300 |
$47,924 |
$1,100 |
Self-reported health |
Poor or Fair |
13% |
$18,200 |
$71,178 |
$1,500 |
Living with a disability |
Yes |
10% |
$16,000 |
$66,801 |
$1,500 |
Living with a disability |
No |
4% |
$9,600 |
$47,278 |
$1,000 |
Debt* |
No debt |
5% |
$15,700 |
$64,523 |
$1,200 |
Debt* |
With other debt |
10% |
$12,600 |
$12,641 |
$1,300 |
Insurance coverage |
Uninsured |
13% |
$40,700 |
$115,666 |
$2,500 |
Insurance coverage |
One source of insurance |
10% |
$15,400 |
$66,319 |
$1,000 |
Insurance coverage |
Two or more sources of insurance** |
6% |
$13,300 |
$58,714 |
$1,500 |
Insurance coverage |
Medicare/Medicaid Dual Beneficiary |
10% |
$15,700 |
$62,316 |
$1,100 |
Source: CFPB analysis of the Census Bureau, Survey of Income and Program Participation 2021, public use files.
* Other debt refers to student, credit card, mortgage and other debts reported in the SIPP, excluding unpaid medical bills.
** Includes Medicare Advantage coverage.
Footnotes
- The CFPB’s Office of Financial Protection for Older Americans prepared this spotlight. The Office was established within the CFPB under the Dodd-Frank Wall Street Reform and Consumer Protection Act of 2010 (Dodd-Frank Act). 12 U.S.C. § 5493(g)(1).
- CFPB analysis of U.S. Census Bureau data from Survey of Income and Program Participation, 2021 (last revised Aug. 17, 2022), https://www.census.gov/programs-surveys/sipp/data.html . Respondents were asked to include bills for doctors, dentists, hospitals, therapists, medication, equipment, nursing home or home care, and exclude bills that will likely be paid by the insurance company or have been paid in full. See Appendix A: Methodology for more information about the survey and the analysis.
- Every year, CFPB receives thousands of consumer complaints about financial products and services and sends those complaints to companies for response. More information about how the CFPB handles these complaints can be found at https://www.consumerfinance.gov/complaint/process/.
- CFPB analysis of U.S. Census Bureau data from Survey of Income and Program Participation, 2021 (last revised Aug. 17, 2022), https://www.census.gov/programs-surveys/sipp/data.html . See Appendix A: Methodology for the exact question wording.
- CFPB analysis of U.S. Census Bureau data from Survey of Income and Program Participation, 2021 (last revised Aug. 17, 2022), https://www.census.gov/programs-surveys/sipp/data.html .
- Several sources of consumer information for Medicare beneficiaries highlight the role of supplemental sources of insurance for Medicare beneficiaries. See Medicare Rights Center, Filling gaps in Medicare coverage and getting help with Medicare costs (last visited Apr. 20, 2023), https://www.medicareinteractive.org/get-answers/medicare-basics/medicare-coverage-overview/filling-gaps-in-medicare-coverage-and-getting-help-with-medicare-costs ; see also Ari Parker, How to Cover the Medical Costs Medicare Doesn't Cover, Nat'l Council on Aging (Nov. 18, 2022), https://ncoa.org/article/how-to-cover-the-medical-costs-medicare-doesnt-cover . For additional benefits provided by Medicare Advantage plans, see Jeannie Fuglesten et al., Extra Benefits Offered by Medicare Advantage Firms Vary, KFF (Nov. 16, 2022), https://www.kff.org/medicare/issue-brief/extra-benefits-offered-by-medicare-advantage-firms-varies/ . Noting that nearly “all plans offer extra benefits not available in traditional Medicare, including coverage of vision (eyeglasses and/or eye exams), hearing (exams and/or aids), fitness, and dental services.”
- Liz Hamel et al., The Burden of Medical Debt: Results from the Kaiser Family Foundation/New York Times Medical Bills Survey, KFF 10 (Jan. 2016), available at https://www.kff.org/wp-content/uploads/2016/01/8806-the-burden-of-medical-debt-results-from-the-kaiser-family-foundation-new-york-times-medical-bills-survey.pdf
- CFPB, Medical debt burden in the United States (Feb. 2022), at 28, https://files.consumerfinance.gov/f/documents/cfpb_medical-debt-burden-in-the-united-states_report_2022-03.pdf .
- CFPB, Medical debt burden in the United States (Feb. 2022), at 28, https://files.consumerfinance.gov/f/documents/cfpb_medical-debt-burden-in-the-united-states_report_2022-03.pdf .
- Peter Boersma et al., Prevalence of Multiple Chronic Conditions Among US Adults, 2018, 17 Prev Chronic Disease (Sept. 17, 2020), https://www.cdc.gov/pcd/issues/2020/20_0130.htm ; see also Christine Buttorff et al., Multiple Chronic Conditions in the United States, RAND Corp. (2017), https://www.rand.org/pubs/tools/TL221.html .
- Lillian Min et al., When comorbidity, aging, and complexity of primary care meet: development and validation of the Geriatric Complexity of Care Index, 4 J. Am. Geriatrics Soc. 542-50 (Apr. 2013), https://www.ncbi.nlm.nih.gov/pmc/articles/PMC3698956 ; Barbara Starfield et al., Comorbidity and the use of primary care and specialist care in the elderly, 3 Annals of Fam. Med., 215–222 (2005), https://www.ncbi.nlm.nih.gov/pmc/articles/PMC1466877/ .
- CFPB analysis shows that 25 percent of older adults with unpaid medical bills face hearing limitations, compared to 6 percent of adults ages 18 to 64. Further, 27 percent of older adults with unpaid medical bills face mobility limitations, compared to 10 percent of adults ages 18 to 64. Finally, 17 percent of older adults with unpaid medical bills face visual limitations, compared to 7 percent of adults ages 18 to 64. CFPB analysis of U.S. Census Bureau data from Survey of Income and Program Participation, 2021 (last revised Aug. 17, 2022), https://www.census.gov/programs-surveys/sipp/data.html .
- CFPB analysis of U.S. Census Bureau data from Survey of Income and Program Participation, 2021 (last revised Aug. 17, 2022), https://www.census.gov/programs-surveys/sipp/data.html .
- To identify relevant complaints, the CFPB conducted a search for consumers mentioning ”Medicare” in complaints submitted between January 2020 and December 2022. Duplicates and complaints mentioning Medicare as a form of identification were excluded. Throughout this report, minor misspellings, as well as grammatical and punctuation errors have been corrected in quoted narratives to increase readability.
- CFPB analysis of U.S. Census Bureau data from Survey of Income and Program Participation, 2021 (last revised Aug. 17, 2022), https://www.census.gov/programs-surveys/sipp/data.html .
- In this report, “federal poverty level” refers to the Federal Poverty Threshold as measured by the Census Bureau rather than the Guidelines. The Guidelines are used for specific eligibility in means-tested programs, are different for Alaska and Hawaii, and have certain income disregards. For more information on how poverty is measured and the differences between the Threshold and Guideline, see U.S. Census Bureau, How the Census Bureau Measures Poverty (last updated Jan. 30, 2023), https://www.census.gov/topics/income-poverty/poverty/guidance/poverty-measures.html . In 2020, the Poverty Level Threshold for a single older adult with no dependent children was $12,413. For Poverty Level Thresholds by year, age of householder, size of family and number of children, see U.S. Census Bureau, Poverty Thresholds (last updated Feb. 7, 2023), https://www.census.gov/data/tables/time-series/demo/income-poverty/historical-poverty-thresholds.html .
- CFPB analysis of U.S. Census Bureau data from Survey of Income and Program Participation, 2021 (last revised Aug. 17, 2022), https://www.census.gov/programs-surveys/sipp/data.html . Debts exclude unpaid medical bills. The analysis is based on student debt (EDEBT_ED), credit card (EDEBT_CC), mortgages (EPRDEBT), and other debt (EDEBT_OT) as reported in the SIPP.
- CFPB analysis of U.S. Census Bureau data from Survey of Income and Program Participation, 2021 (last revised Aug. 17, 2022), https://www.census.gov/programs-surveys/sipp/data.html . In 2020, 99 percent of adults ages 65 and older had at least one source of health insurance coverage, with 94 percent of them covered under Medicare.
- David U. Himmelstein et al., Prevalence and Risk Factors for Medical Debt and Subsequent Changes in Social Determinants of Health in the US, JAMA 5:9 (2022), available at https://jamanetwork.com/journals/jamanetworkopen/fullarticle/2796358 . See also Liz Hamel et al., The Burden of Medical Debt: Results from the Kaiser Family Foundation/New York Times Medical Bills Survey, KFF 10 (Jan. 2016), available at https://www.kff.org/wp-content/uploads/2016/01/8806-the-burden-of-medical-debt-results-from-the-kaiser-family-foundation-new-york-times-medical-bills-survey.pdf .
- CFPB analysis of U.S. Census Bureau data from Survey of Income and Program Participation, 2021 (last revised Aug. 17, 2022), https://www.census.gov/programs-surveys/sipp/data.html . In comparison, the total amount reported in unpaid medical bills increased by 22 percent, from $251 billion to $307 billion among adults ages 18 to 64, between 2019 and 2020.
- CFPB analysis of U.S. Census Bureau data from Survey of Income and Program Participation, 2021 (last revised Aug. 17, 2022), https://www.census.gov/programs-surveys/sipp/data.html .
- See Tricia Neuman et al., Monthly Part B Premiums and Annual Percentage Increases, KFF (Jan. 12, 2022), https://www.kff.org/medicare/slide/monthly-part-b-premiums-and-annual-percentage-increases/ . This growth is also higher than the overall growth in Medicare spending between 2019 and 2020 (3.4 percent). See CMS, Office of the Actuary, Table 3: National Health Expenditures; Levels and Annual Percent Change, by Source of Funds: Selected Calendar Years 1960-2021, (last updated Dec. 15, 2022) https://www.cms.gov/files/zip/nhe-tables.zip .
- For example, older adults with unpaid bills reported an average of 10 doctors’ visits in 2020, compared to 11 visits on average, in 2019. Similarly, the average amount of out-of-pocket expenses reported by older adults with unpaid bills decreased from $1,540 in 2019 to $1,450 in 2020. CFPB analysis of U.S. Census Bureau data from Survey of Income and Program Participation, 2021 (last revised Aug. 17, 2022), https://www.census.gov/programs-surveys/sipp/data.html .
- MedPac, March 2023 Report to the Congress: Medicare Payment Policy 22 (Mar. 2023), available at https://www.medpac.gov/wp-content/uploads/2023/03/Mar23_MedPAC_Report_To_Congress_SEC.pdf .
- Most notably, improvements include the creation of Medicare Part D in 2006, changes to the Medicare Savings Programs and the Part D Low-Income Subsidy program in 2009, and the expansion of prevention benefits covered under Medicare under the Affordable Care Act in 2010. See KFF, Medicare Timeline (Mar. 24, 2015), https://www.kff.org/medicare/timeline/medicare-timeline .
- CFPB analysis of U.S. Census Bureau data from Survey of Income and Program Participation, 2021 (last revised Aug. 17, 2022), https://www.census.gov/programs-surveys/sipp/data.html .
- MedPac, March 2022 Report to the Congress: Medicare Payment Policy 23 (Mar. 2022), available at https://www.medpac.gov/wp-content/uploads/2022/03/Mar22_MedPAC_ReportToCongress_v3_SEC.pdf .
- CFPB analysis of U.S. Census Bureau data from Survey of Income and Program Participation, 2021 (last revised Aug. 17, 2022), https://www.census.gov/programs-surveys/sipp/data.html . See also, NCHS, National Health Interview Survey. Figure 20. Supplemental insurance coverage among adults aged 65 and over with Medicare coverage, by type of supplemental coverage: United States, 2010–2018. (2019), https://www.cdc.gov/nchs/hus/contents2019.htm#Figure-020
- CFPB analysis of U.S. Census Bureau data from Survey of Income and Program Participation, 2021 (last revised Aug. 17, 2022), https://www.census.gov/programs-surveys/sipp/data.html .
- CFPB analysis of U.S. Census Bureau data from Survey of Income and Program Participation, 2021 (last revised Aug. 17, 2022), https://www.census.gov/programs-surveys/sipp/data.html .
- CFPB analysis of U.S. Census Bureau data from Survey of Income and Program Participation, 2021 (last revised Aug. 17, 2022), https://www.census.gov/programs-surveys/sipp/data.html .
- The SIPP provides a robust set of variables to examine factors that may explain unpaid medical bills. CFPB analyzed the SIPP data to identify older adults who had (a) unpaid bills in the prior year (2019), (b) an above-average number of provider visits, (c) out pocket expenses that exceeded 10 percent of their income, (d) no insurance or Medicare only coverage, (e) incomes below 200 percent of the federal poverty status, (f) HMO coverage, for example, through Medicare Advantage (which may indicate out-of-network coverage issues), and (g) reported poor health. The analysis shows that 96 percent of older adults with unpaid bills in 2020 exhibited one of these characteristics, yet 82 percent of older adults without unpaid bills also exhibited one of these characteristics. This suggests that other important predictors of unpaid bills are missing, including erroneous billing. CFPB analysis of U.S. Census Bureau data from Survey of Income and Program Participation, 2021 (last revised Aug. 17, 2022), https://www.census.gov/programs-surveys/sipp/data.html .
- Estimates of the prevalence of medical billing errors range from about 7 percent to 49 percent. For example, the American Medical Association estimated that 7.1 percent of paid claims in 2013 contained an error. See, Thomas Sullivan, AMA’s National Health Insurer Report Card – $12 Billion Could be Saved Through Increased Claims Automation (July 18, 2013), https://www.policymed.com/2013/07/amas-national-health-insurer-report-card-12-billion-could-be-saved-through-increased-claims-automation.html . On the other hand, NerdWallet Health analyzed data from the Office of the Inspector General in 2013 Medicare Compliance Reviews of U.S. hospitals and found that that 49 percent of the Medicare medical claims contained medical billing errors. See, Christina LaMontagne, NerdWallet Health study: Medical debt crisis worsening despite health care policy advances (Oct. 2014), https://content.money.com/wp-content/uploads/2015/04/nerdwallet-health-study-medical-debt-crisis-worsening-despite-health-care-policy-advances.pdf .
- Aaron Schwartz et al., Coverage Denials: Government and Private Insurer Policies for Medical Necessity in Medicare, 41 Health Affairs. 1, 120-128 (2022). High rates of denials are also found in other federally regulated health insurance markets. For example, KFF, using CMS Healthcare.gov Marketplace data, found that “nearly 17% of in-network claims were denied in 2021. Insurer denial rates varied widely around this average, ranging from 2% to 49%.” Karen Pollitz et al., Claims Denials and Appeals in ACA Marketplace Plans in 2021, KFF (Feb. 9, 2023), https://www.kff.org/private-insurance/issue-brief/claims-denials-and-appeals-in-aca-marketplace-plans . See also Experian Health, Report: The State of Claims: Survey 2022 (Sept. 2022), https://www.experian.com/healthcare/resources-insights/thought-leadership/white-papers-insights/state-claims-report .
- Change Healthcare, The Change Healthcare 2020 Revenue Cycle Denials Index (2020), https://www.ache.org/-/media/ache/about-ache/corporate-partners/the_change_healthcare_2020-revenue_cycle_denials_index.pdf .
- Several companies working on claim management and revenue cycles for health care providers state that approximately 60 to 65 percent of denied claims are never resubmitted. See, e.g., Glen Reiner, Success in Proactive Denials Management and Prevention, Healthcare Fin. Mgmt. Ass’n (Aug. 29, 2018), https://www.hfma.org/revenue-cycle/denials-management/61778 .
- Lunna Lopes et al., Health Care Debt in the U.S.: Broad Consequences of Medical and Dental Bills, KFF (July 2022), https://www.kff.org/health-costs/report/kff-health-care-debt-survey/ .
- Peter Boersma et al., Prevalence of Multiple Chronic Conditions Among US Adults, 2018, 17 Prev Chronic Disease (Sept. 17, 2020), https://www.cdc.gov/pcd/issues/2020/20_0130.htm ; see also Christine Buttorff et al., Multiple Chronic Conditions in the United States, RAND Corp. (2017), https://www.rand.org/pubs/tools/TL221.html .
- Lillian Min et al., When comorbidity, aging, and complexity of primary care meet: development and validation of the Geriatric CompleXity of Care Index, 4 J. Am. Geriatrics Soc. 542-50 (Apr. 2013), https://www.ncbi.nlm.nih.gov/pmc/articles/PMC3698956 ; Barbara Starfield et al., Comorbidity and the use of primary care and specialist care in the elderly, 3 Annals of Fam. Med., 215–222 (2005), https://www.ncbi.nlm.nih.gov/pmc/articles/PMC1466877/ .
- For example, for Medicare beneficiaries, hospitals and providers use CMS’s Healthcare Common Procedure Coding System (HCPCS) Codes to bill for their evaluation and management services. These codes are based on the American Medical Association’s Current Procedural Terminology (CPT) codes. More information about the development and history of CPT codes can be found at https://www.ama-assn.org/practice-management/cpt/cpt-overview-and-code-approval . Examples involving complex care and billing codes can be found at https://www.ama-assn.org/system/files/steps-forward-documentation-coding-toolkit.pdf .
- For example, “higher-intensity” care claims, such as complex chronic care management services, require specific types of care and amounts of time spent with a patient, and they need to be supported by documentation. See, e.g., CMS, Chronic Care Management Services, MLN909188 (Sept. 2022), https://www.cms.gov/outreach-and-education/medicare-learning-network-mln/mlnproducts/downloads/chroniccaremanagement.pdf .
- Upcoding refers to the practice of assigning an inaccurate billing code to a medical procedure or treatment to increase reimbursement. It is considered a form of abuse of the Medicare program. See, e.g. CMS, Medicare Fraud & Abuse: Prevent, Detect, Report, (Jan. 2021), https://www.cms.gov/Outreach-and-Education/Medicare-Learning-Network-MLN/MLNProducts/Downloads/Fraud-Abuse-MLN4649244.pdf .
- Recent studies have raised concerns about the increasing use of billing for high-intensity care. For example, the U.S. Department of Health & Human Services Office of Inspector General conducted an audit focused on hospitals’ upcoding billing practices. The audit found that “hospitals are increasingly billing for inpatient stays at the highest severity level” and recommended that CMS conduct targeted reviews of hospital stays that are likely to result in upcoding and the hospitals that frequently bill them. See, U.S. DHHS OIG, Trend Toward More Expensive Inpatient Hospital Stays in Medicare Emerged Before COVID-19 and Warrants Further Scrutiny (Feb. 2021), https://oig.hhs.gov/oei/reports/OEI-02-18-00380.pdf . See, e.g. Laura G. Burke et al., Are trends in billing for high-intensity emergency care explained by changes in services provided in the emergency department? An observational study among US Medicare beneficiaries, 8 British Med. J. (Jan. 30, 2018), https://pubmed.ncbi.nlm.nih.gov/29382680/ . Similar concerns are seen in billing coding for the non-Medicare population. See, e.g., Hope Schwartz et al., Outpatient visits billed at increasingly higher levels: implications for health costs, KFF (Feb. 2023), https://www.healthsystemtracker.org/brief/outpatient-visits-are-increasingly-billed-at-higher-levels-implications-for-health-costs/ .
- CFPB analysis of U.S. Census Bureau data from Survey of Income and Program Participation, 2021 (last revised Aug. 17, 2022), https://www.census.gov/programs-surveys/sipp/data.html .
- Joshua D. Gottlieb et al., The Complexity of Billing and Paying for Physician Care, Health Aff. 37, 37 (Apr. 2018). This study found that the highest denial rates for claims involved secondary payers such as Medigap or Medicaid. The study looked at the share of claims denied, the number of times claims were adjusted before payment, and the length of time it took for insurers to pay a claim when they did.
- CMS has established Coordination of Benefits Agreements (COBA) with insurers and benefit programs (also known as trading partners) that allow the exchange of eligibility information and Medicare claims data to and from CMS for processing supplemental insurance benefits from CMS’ national crossover contractor, the Benefits Coordination & Recovery Center (BCRC). See CMS, Coordination of Benefits Agreement (last modified Jan. 9, 2023), https://www.cms.gov/medicare/coordination-of-benefits-and-recovery/coba-trading-partners/coordination-of-benefits-agreements/coordination-of-benefits-agreement-page . For claims involving dual eligibility, Medicare will usually forward the claim to the state Medicaid agency or its contractor for processing.
- Some insurance companies do not participate in the Medicare crossover process at all.
- An inaccurate or missing National Provider Identifier is a common reason for a Medicare crossover claim to be rejected. See, e.g. California Dep’t of Health Care Services, Medicare/Medi-Cal Crossover Claims Overview (last updated Aug. 2020), https://files.medi-cal.ca.gov/pubsdoco/Publications/masters-MTP/Part1/medicare.pdf .
- California Dep’t of Health Care Services, Medicare/Medi-Cal Crossover Claims Overview (last updated Aug. 2020), https://files.medi-cal.ca.gov/pubsdoco/Publications/masters-MTP/Part1/medicare.pdf .
- Data for 2019 on payments and costs show that providers were less likely to receive the full amount billed for services provided to people with Medicare and additional insurance. For example, providers did not receive the full amount billed for services provided to 92 percent of people with two insurance sources and 48 percent of people with Medicare only, as measured by variable PAMTDISC in the survey. CFPB analysis of CMS data from 2019 Medicare Current Beneficiary Cost Supplement File Public Use File: Data files and code books (2023), https://www.cms.gov/Research-Statistics-Data-and-Systems/Downloadable-Public-Use-Files/MCBS-Public-Use-File/index .
- In Texas, provider agreements must include language that requires the provider to look to the managed care organization, rather than the insured consumer, for payment of covered services beyond the patient liability (coinsurance or copay). 28 Tex. Admin. Code § 11.901(a)(1). It is unclear whether discounts include bills that providers have agreed not to seek from consumers, under a hold-harmless clause.
- To identify relevant complaints, the CFPB conducted a keyword search for Medicare-related complaints mentioning additional sources of insurance such as Medicaid, QMB, Medigap, and Tricare. Then CFPB staff validated the search results by reading the complaint narratives.
- CFPB Consumer Complaint 6588000, https://www.consumerfinance.gov/data-research/consumer-complaints/search/detail/6588000.
- CFPB Consumer Complaint 3234389, https://www.consumerfinance.gov/data-research/consumer-complaints/search/detail/3234389.
- More information about enrollment numbers and categories of dual-coverage can be found in this report of the Medicare Payment Advisory Commission (MACPAC) & the Medicaid and CHIP Payment and Access Commission (MedPAC), Data Book: Beneficiaries Dually Eligible for Medicare and Medicaid (Feb. 2023), https://www.macpac.gov/wp-content/uploads/2023/02/Feb23_MedPAC_MACPAC_DualsDataBook-WEB-508.pdf ; see also, CMS, Dually Eligible Individuals – Categories (2021) (last visited Apr. 20, 2023), https://www.cms.gov/Medicare-Medicaid-Coordination/Medicare-and-Medicaid-Coordination/Medicare-Medicaid-Coordination-Office/Downloads/MedicareMedicaidEnrolleeCategories.pdf .
- Two-thirds (66 percent) of older dually eligible beneficiaries are enrolled in the Qualified Medicare Beneficiary (QMB) Program, which covers Parts A and B premiums and cost-sharing. See Medicare Payment Advisory Commission (MACPAC) & the Medicaid and CHIP Payment and Access Commission (MedPAC), Data Book: Beneficiaries Dually Eligible for Medicare and Medicaid (Feb. 2023), https://www.macpac.gov/wp-content/uploads/2023/02/Feb23_MedPAC_MACPAC_DualsDataBook-WEB-508.pdf .
- Approximately 70 percent of older dually eligible beneficiaries receive full Medicaid coverage, which may also cover services not generally covered under Medicare, including dental, vision, and long-term services and supports. See Medicare Payment Advisory Commission (MACPAC) & the Medicaid and CHIP Payment and Access Commission (MedPAC), Data Book: Beneficiaries Dually Eligible for Medicare and Medicaid (Feb. 2023), https://www.macpac.gov/wp-content/uploads/2023/02/Feb23_MedPAC_MACPAC_DualsDataBook-WEB-508.pdf
- Medicare Learning Network, MLN Matters Number SE1128: Prohibition Billing Dually Eligible Individuals Enrolled in the Qualified Medicare Beneficiary (QMB) Program (June 26, 2018), https://www.cms.gov/Outreach-and-Education/Medicare-Learning-Network-MLN/MLNMattersArticles/downloads/se1128.pdf
- This figure refers to older adults enrolled in the Qualified Medicare Beneficiary (QMB) Program, which covers Parts A and B premiums and cost-sharing. See Medicare Payment Advisory Commission (MACPAC) & the Medicaid and CHIP Payment and Access Commission (MedPAC), Data Book: Beneficiaries Dually Eligible for Medicare and Medicaid (Feb. 2023), https://www.macpac.gov/wp-content/uploads/2023/02/Feb23_MedPAC_MACPAC_DualsDataBook-WEB-508.pdf
- Federal law limits the “cost sharing” amount that states can require dually eligible beneficiaries to pay for Medicaid-covered services. For example, $4 is the most that states can allow physicians and physical therapists to charge dually eligible beneficiaries with family income less than or equal to the Federal Poverty Level (FPL). Similarly, states can allow pharmacies to charge up to $4 in cost sharing for preferred drugs or $8 for non-preferred drugs, if family income is less than or equal to 150 percent of the FPL. 42 U.S.C. § 447.52(b)(1), § 447.53 (b).
- Medicare Payment Advisory Commission (MACPAC) & the Medicaid and CHIP Payment and Access Commission (MedPAC), Data Book: Beneficiaries Dually Eligible for Medicare and Medicaid (Feb. 2023), https://www.macpac.gov/wp-content/uploads/2023/02/Feb23_MedPAC_MACPAC_DualsDataBook-WEB-508.pdf
- Medicare Payment Advisory Commission (MACPAC) & the Medicaid and CHIP Payment and Access Commission (MedPAC), Data Book: Beneficiaries Dually Eligible for Medicare and Medicaid (Feb. 2023), https://www.macpac.gov/wp-content/uploads/2023/02/Feb23_MedPAC_MACPAC_DualsDataBook-WEB-508.pdf
- Because of the longitudinal design of the SIPP, CFPB was able to determine whether respondents with unpaid bills in 2020 also reported unpaid bills in 2019, and whether they had consistent insurance coverage. The analysis shows that 66 percent of dually eligible older adults with unpaid bills in 2020 did not have unpaid bills in 2019. The analysis also shows that 96 percent of dually eligible older adults in 2020 maintained consistent dual coverage throughout 2020. Both findings suggest that for the majority of dually eligible older adults, unpaid bills reported for 2020 were acquired while covered by Medicare and Medicaid. CFPB analysis of U.S. Census Bureau data from Survey of Income and Program Participation, 2021 (last revised Aug. 17, 2022), https://www.census.gov/programs-surveys/sipp/data.html .
- CFPB analysis of U.S. Census Bureau data from Survey of Income and Program Participation, 2021 (last revised Aug. 17, 2022), https://www.census.gov/programs-surveys/sipp/data.html .
- Some dually eligible older adults, however, may have unpaid bills that predate their Medicare and Medicaid coverage. Other categories of dually-eligible older adults such as the Qualified Individuals (QIs) and Specified Low-Income Medicare Beneficiaries (SLMBs), who have lesser coverage, may have unpaid bills for Medicare cost-sharing.
- A 2014 study commissioned by CMS found that “providers balance billed dual-eligible beneficiaries for [more than federally allowable] cost-sharing,” “erroneous billing occurred,” and “unpaid bills were submitted to collection agencies.” See CMS, Access to Care Issues Among Qualified Medicare Beneficiaries (QMB), (July 2015), at v. https://www.cms.gov/Medicare-Medicaid-Coordination/Medicare-and-Medicaid-Coordination/Medicare-Medicaid-Coordination-Office/Downloads/Access_to_Care_Issues_Among_Qualified_Medicare_Beneficiaries.pdf.
- In 2017, CFPB and CMS issued a joint blog post advising consumers of their rights when they are wrongfully billed for Medicare costs. Stacy Canan & Tim Engelhardt, What to do if you’re wrongfully billed for Medicare costs: Know your rights as a Qualified Medicare Beneficiary (last updated May 10, 2019), https://www.consumerfinance.gov/about-us/blog/what-do-if-youre-wrongfully-billed-medicare-costs/.
- CFPB Consumer Complaint 3771766, https://www.consumerfinance.gov/data-research/consumer-complaints/search/detail/3771766.
- CFPB Consumer Complaint 4820851, https://www.consumerfinance.gov/data-research/consumer-complaints/search/detail/4820851.
- CFPB, Medical debt burden in the United States (Feb. 2022), at 28, https://files.consumerfinance.gov/f/documents/cfpb_medical-debt-burden-in-the-united-states_report_2022-03.pdf .
- The CFPB’s Consumer Credit Panel (CCP) is a national 1-in-48 sample of de-identified credit records maintained by one of the three nationwide consumer reporting agencies. A collections tradeline is an item on a consumer credit report. The CCP includes information about an individual’s allegedly unpaid bills. Credit scoring models use the information contained in tradelines, including collections tradelines, to generate a consumer’s credit score. Collections tradelines, which are considered negative, generally may appear on a consumer report for up to seven years.
- CFPB analysis of data from CFPB’s Consumer Credit Panel (CCP). There are two possible explanations for the differences between the number of people with medical collection tradelines estimated by the CCP and the number of people with unpaid medical bills estimated by the SIPP. One possible explanation is that that many older adults in the SIPP may not be reporting unpaid medical bills accrued and reported to credit reporting agencies prior to 2020 (the year of the survey). Another explanation is that many older adults may not know that they have a medical collection tradeline from an unpaid bill in their credit report.
- CFPB, Paid and Low-Balance Medical Collections on Consumer Credit Reports (July 27, 2022), https://www.consumerfinance.gov/data-research/research-reports/paid-and-low-balance-medical-collections-on-consumer-credit-reports/.
- CFPB Consumer Complaint 5269225, https://www.consumerfinance.gov/data-research/consumer-complaints/search/detail/5269225.
- In a nationally representative survey, 1 in 7 adults with health care debt said that a healthcare provider refused to treat them because of unpaid medical bills. See Lunna Lopes et al., Health Care Debt in the U.S.: Broad Consequences of Medical and Dental Bills, KFF (July 2022), https://www.kff.org/health-costs/report/kff-health-care-debt-survey/ . See also Monica Williams et al., Can doctors deny treatment for unpaid medical bills? ABC 15 (Aug. 23, 2019), https://www.abc15.com/news/let-joe-know/can-doctors-deny-treatment-for-unpaid-medical-bills .
- CFPB analysis of the Federal Reserve Board Survey of Household Economic and Decision-making. See also David U. Himmelstein et al., Prevalence and Risk Factors for Medical Debt and Subsequent Changes in Social Determinants of Health in the US, JAMA 5:9 (2022), available at https://jamanetwork.com/journals/jamanetworkopen/fullarticle/2796358 .
- The limited resources devoted to correcting and resubmitting denied claims is a common issue discussed among billing and revenue cycle experts, and groups that advocate for medical providers. Generally, these sources concur that up to 90 percent of denied claims can be prevented. See, e.g., Glen Reiner, Success in Proactive Denials Management and Prevention, Healthcare Fin. Mgmt. Ass’n (Aug. 29, 2018), https://www.hfma.org/revenue-cycle/denials-management/61778 .https://www.hfma.org/revenue-cycle/denials-management/61778 ; Timothy Mills, Why Getting Claims Right the First Time Is Cheaper than Reworking Them. Physicians Practice. MJH Life Sciences, (Sep. 9, 2019) https://www.physicianspractice.com/view/why-getting-claims-right-first-time-cheaper-reworking-them ; Lori Zindl, Measuring the Cost of Denials and the Impact of Prevention, OsInc. (Aug. 23, 2021), https://www.os-healthcare.com/news-and-blog/measuring-the-cost-of-denials-and-impact-of-prevention . Pararev, The 7 Most Common Root Causes for Denials and Delayed Account Resolution,(2023) https://go.pararevenue.com/rs/037-XBO-999/images/7_most_common_root_causes_WP.pdf .
- See CMS, Access to Care Issues Among Qualified Medicare Beneficiaries (QMB), (July 2015), https://www.cms.gov/Medicare-Medicaid-Coordination/Medicare-and-Medicaid-Coordination/Medicare-Medicaid-Coordination-Office/Downloads/Access_to_Care_Issues_Among_Qualified_Medicare_Beneficiaries.pdf . Finding that most of the participants simply paid the [prohibited] balance bills received. They moved forward with payment for a variety of reasons (e.g., they were unaware of prohibited billing, they tired of “fighting the system,” or they worried about the impact on their health care or their relationships with providers if they did not pay the bills.” See also, Penelope Wang, Sick of Confusing Medical Bills?, Consumer Reports (Aug. 1, 2018), https://www.consumerreports.org/medical-billing/sick-of-confusing-medical-bills/ . Finding that “more than one-third of respondents said they paid bills they weren't sure they owed. Among the reasons they gave for doing this: The bill was too confusing, they were uncertain their efforts would make a difference, and they were concerned that not paying would hurt their credit record.”
- CFPB, Data Point: Consumer Credit and the Removal of Medical Collections from Credit Reports (Apr. 2023), https://files.consumerfinance.gov/f/documents/cfpb_consumer-credit-removal-medical-collections-from-credit-reports_2023-04.pdf Finding patterns in mortgage inquiries among people with medical collection tradelines that suggest that people seeking a first-lien mortgage may work to remove medical collections from their credit report as part of their process of applying for a mortgage.
- CFPB Consumer Complaint 5079680, https://www.consumerfinance.gov/data-research/consumer-complaints/search/detail/5079680.
- CFPB Consumer Complaint 4712348, https://www.consumerfinance.gov/data-research/consumer-complaints/search/detail/4712348.
- CFPB Consumer Complaint 5763706, https://www.consumerfinance.gov/data-research/consumer-complaints/search/detail/5763706.
- CFPB Consumer Complaint 4712348, https://www.consumerfinance.gov/data-research/consumer-complaints/search/detail/4712348.
- CFPB analysis shows that 25 percent of older adults with unpaid medical bills face hearing limitations, compared to 6 percent of adults ages 18 to 64. Further, 27 percent of older adults with unpaid medical bills face mobility limitations, compared to 10 percent of adults ages 18 to 64. Finally, 17 percent of older adults with unpaid medical bills face visual limitations, compared to 7 percent of adults ages 18 to 64. CFPB analysis of U.S. Census Bureau data from Survey of Income and Program Participation, 2021 (last revised Aug. 17, 2022), https://www.census.gov/programs-surveys/sipp/data.html .
- See CMS, Access to Care Issues Among Qualified Medicare Beneficiaries (QMB), (July 2015), finding that although the amount of some balance bills may seem nominal, the impact of a bill for even $10 or $15 had an effect on participants. Regardless of the amount, participants and their families spent a great deal of time and energy trying to understand and correct potentially erroneous bills.” https://www.cms.gov/Medicare-Medicaid-Coordination/Medicare-and-Medicaid-Coordination/Medicare-Medicaid-Coordination-Office/Downloads/Access_to_Care_Issues_Among_Qualified_Medicare_Beneficiaries.pdf .
- CFPB analysis of the Federal Reserve Board Survey of Household Economic and Decision-making, 2019-2021 pooled data. The public-use version of the survey dataset, and the survey documentation can be found at https://www.federalreserve.gov/publications/report-economic-well-being-us-households.htm .
- These changes include extending the waiting period for an unpaid bill to become reflected as an “account in collections” from a six-month period (180 days) to a one-year period and removing medical collections with balances below a threshold of “at least” $500 from consumer credit reports. Experian, Equifax, Experian, and TransUnion Support U.S. Consumers With Changes to Medical Collection Debt Reporting (Mar. 18, 2022), https://www.experianplc.com/media/latest-news/2022/equifax-experian-and-transunion-support-us-consumers-with-changes-to-medical-collection-debt-reporting/ .
- CFPB, Market Snapshot: Trends in Third-Party Debt Collections Tradelines Reporting (Feb. 14, 2023), https://www.consumerfinance.gov/data-research/research-reports/market-snapshot-trends-in-third-party-debt-collections-tradelines-reporting/.
- CFPB, Market Snapshot: Trends in Third-Party Debt Collections Tradelines Reporting (Feb. 14, 2023), https://www.consumerfinance.gov/data-research/research-reports/market-snapshot-trends-in-third-party-debt-collections-tradelines-reporting/.